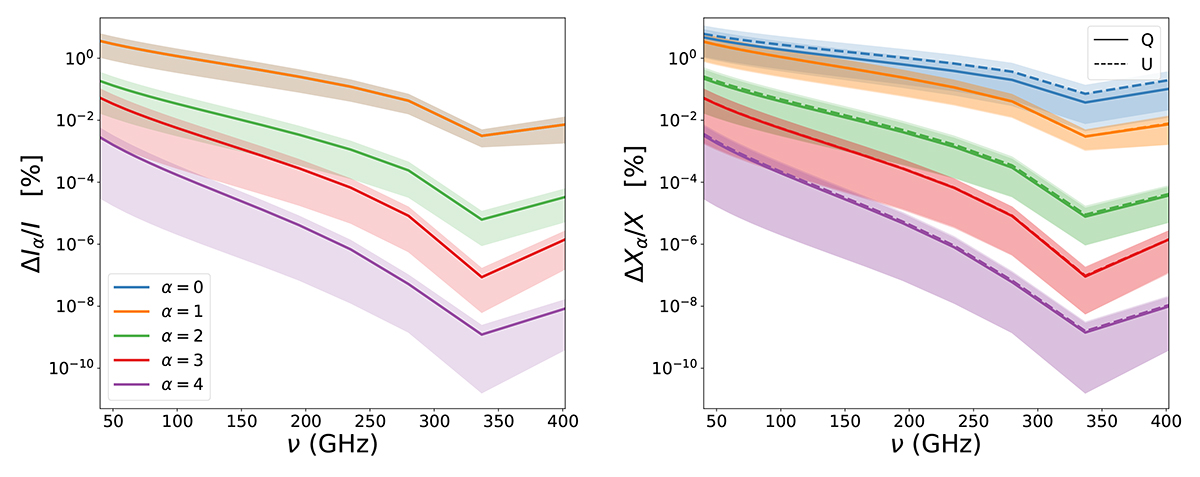
Fig. 2.
Download original image
Residuals ΔXα/X of the spin-moment expansion for d12 expressed in percentages for the 15 bands of the LiteBIRD instrument. In the left panel is X=I, and X=Q, U is displayed in the right panel. The residuals were computed on the full sky up to a different order (α) of the expansion. The lines correspond to the median values, while the shaded areas mark the values of the median absolute deviation. We note that the blue (α = 0) and the orange (α = 1) curves are superimposed in the left panel.
Current usage metrics show cumulative count of Article Views (full-text article views including HTML views, PDF and ePub downloads, according to the available data) and Abstracts Views on Vision4Press platform.
Data correspond to usage on the plateform after 2015. The current usage metrics is available 48-96 hours after online publication and is updated daily on week days.
Initial download of the metrics may take a while.