Fig. A.1.
Download original image
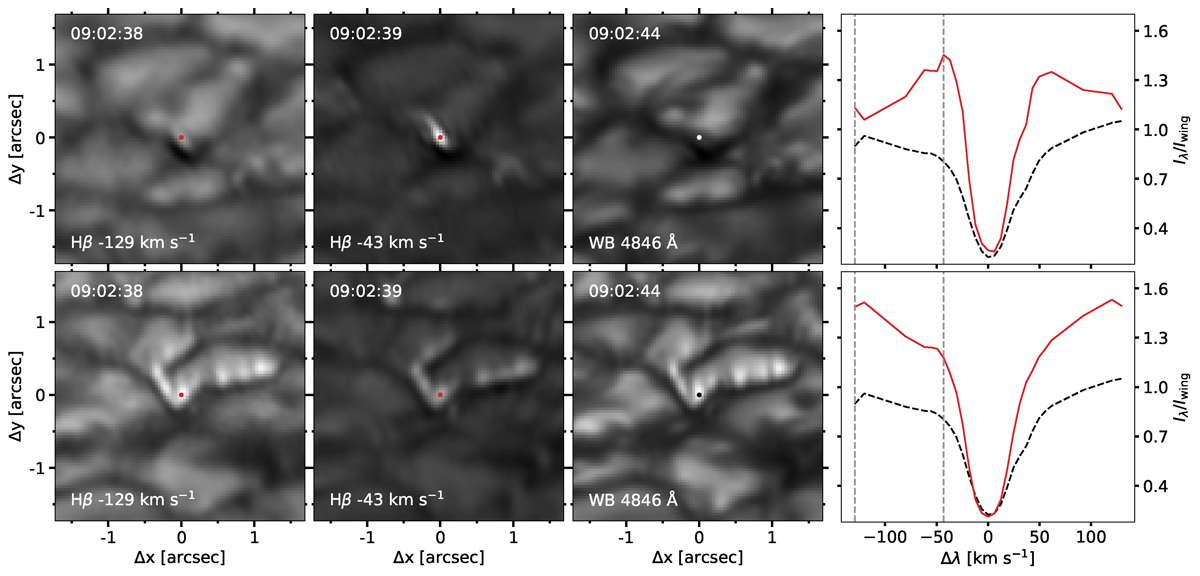
Two separate regions of the FOV showing a QSEB in the upper panels vs a cluster of MCs in the lower panels. The first two columns show the region of the QSEB and MCs as shown by the narrowband filter images; the labels in the lower left corners define the wavelength positions of the images. The third column shows the regions of the QSEB and MCs as shown by the wideband filter images. Each column follows the same scaling. The last column shows the spectral profiles for the separate features (solid red) and the background profile (dashed black); the vertical lines represent the wavelength positions for the two first columns. The spectra are acquired from the pixel marked by the red dot in the centre of the images. The white and black dots in the wideband images help guide the eye. A movie of these features is available in the online material.
Current usage metrics show cumulative count of Article Views (full-text article views including HTML views, PDF and ePub downloads, according to the available data) and Abstracts Views on Vision4Press platform.
Data correspond to usage on the plateform after 2015. The current usage metrics is available 48-96 hours after online publication and is updated daily on week days.
Initial download of the metrics may take a while.