Fig. 6.

Download original image
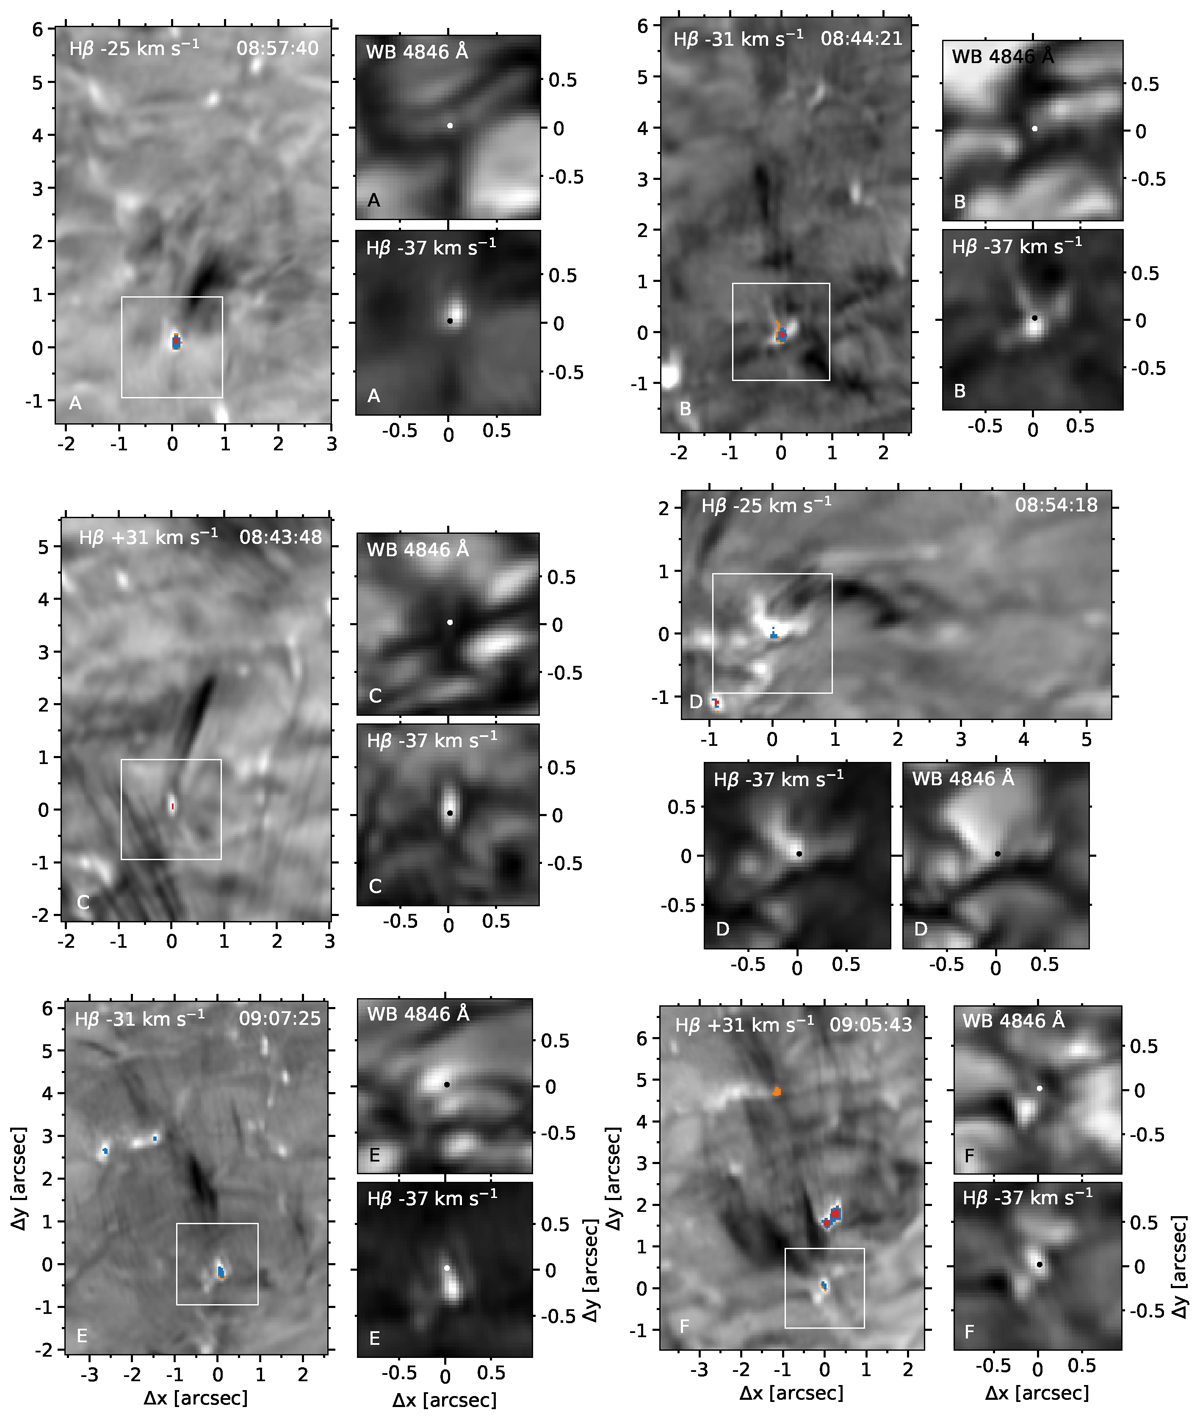
Six events, A–F, of QSEBs that are associated with the formation of type II spicules. The big panels show the spicule(s) and their connected QSEB(s). Coloured pixels mark QSEB detections. Events A, B, D and E are in the Hβ blue wing, while events C and F are in the Hβ red wing. The smaller panels show the WB 4846 Å and Hβ blue wing images, zoomed in on the white square in their respective big panels. The dots in the small panels are there to highlight the difference in brightening between the WB 4846 Å and Hβ blue wing images. All events have accompanying videos online. In addition to these six events, the online videos include the events of Figs. 3 and 4 in this 3-panel format.
Current usage metrics show cumulative count of Article Views (full-text article views including HTML views, PDF and ePub downloads, according to the available data) and Abstracts Views on Vision4Press platform.
Data correspond to usage on the plateform after 2015. The current usage metrics is available 48-96 hours after online publication and is updated daily on week days.
Initial download of the metrics may take a while.


