Fig. 5.
Download original image
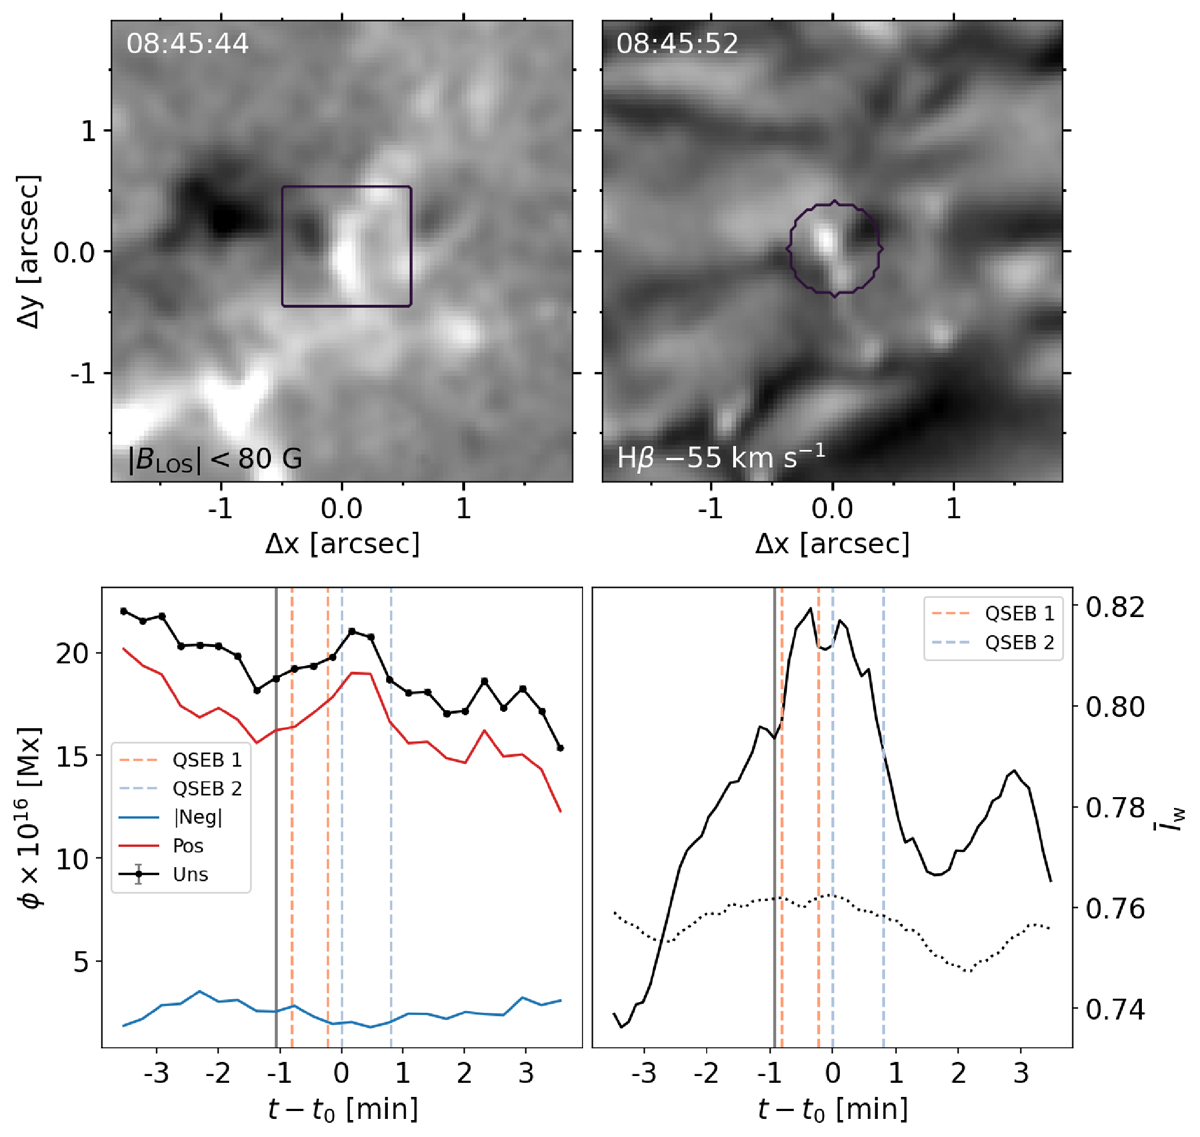
Evolution of the photospheric magnetic field in the area of the QSEB in Fig. 4. The top left panel shows the magnetic field BLOS at a time just before the first detection of two successive QSEBs. The bottom left panel shows the evolution of the magnetic flux ϕ inside the purple square in the BLOS panel. Vertical dashed lines mark the periods of detections of two QSEBs. QSEB 2 is connected to the spicule formation shown in Fig. 4. The top right panel shows an Hβ wing image. The bottom right panel shows the light curve of the integrated Hβ inner wing intensity on both sides of the line core (offsets between 31 and 62 km s−1) inside the purple circle in the wing image above, normalised to the outer wing intensity of the quiet Sun reference profile. The dotted line is the light curve of the full FOV of the above image. The vertical solid lines in the lower panels mark the time of the images in the upper panels. An animation of this figure is available online.
The BLOS map in the upper left panel in Fig. 5 shows two touching opposite polarity patches, and the Hβ wing image shows a clear brightening located at the polarity inversion line. The lower left panel shows that the negative magnetic flux in the area of the purple square decreases during the lifetime of QSEB 1 and the total flux decreases with QSEB 2. The QSEB 2 Hβ wing enhancement declines along with the decrease in flux.
Figure 6 shows snapshots of six other events of QSEBs connected to spicule formation. The large panel of event A shows the first of two separate spicules forming after one another, appearing to originate from the same QSEB event. Event B shows two parallel spicules forming from a QSEB. Event C shows a lonely spicule forming from a QSEB. Event D shows many spicules forming from a cluster of QSEBs. Event E shows a snapshot of increased spicular activity in the blue wing related to increased QSEB activity. Event F shows the magnetic patch just below that of event E, in the red wing.
Current usage metrics show cumulative count of Article Views (full-text article views including HTML views, PDF and ePub downloads, according to the available data) and Abstracts Views on Vision4Press platform.
Data correspond to usage on the plateform after 2015. The current usage metrics is available 48-96 hours after online publication and is updated daily on week days.
Initial download of the metrics may take a while.