Fig. 4.
Download original image
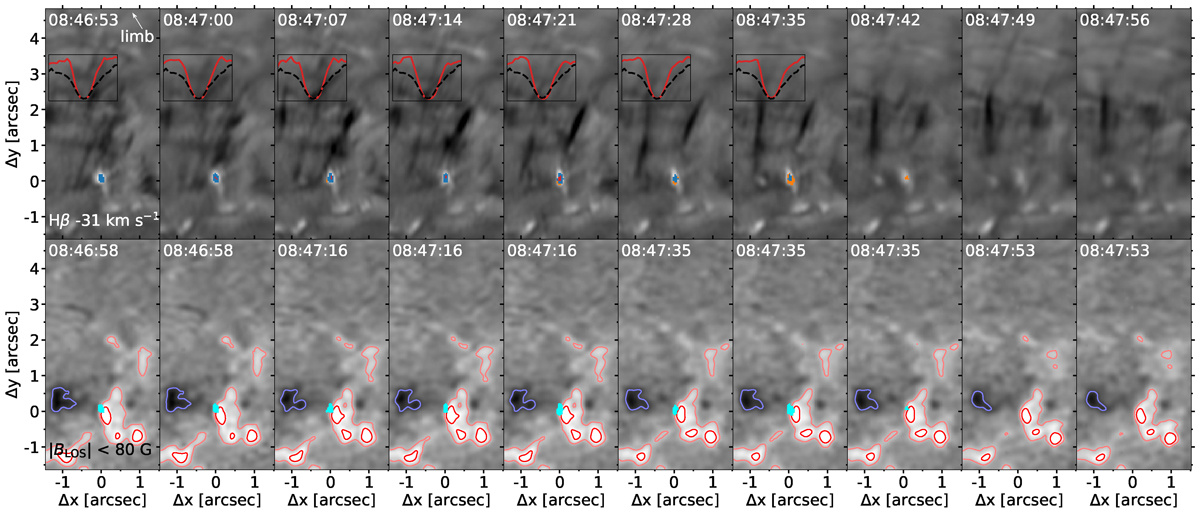
Second example of a spicule connected to a QSEB, along with the evolution of the photospheric magnetic field. Top row: Sequence of H-beta wing images at 7 s cadence, in the same style as Fig. 3. Coloured pixels mark QSEB detections, following the colour scheme of Fig. 2. Bottom row: Evolution of the magnetic field BLOS. The dark red contours encapsulate absolute field strengths stronger than 80 G, and light red and blue contours encapsulate |BLOS|≥40 G (∼7σ). The cyan colour marks the QSEB pixels detected by the k-means model. Several of these frames are duplicates, as the cadence of the CHROMIS dataset is more than twice as high compared to the CRISP dataset. A movie of this event is available online.
Current usage metrics show cumulative count of Article Views (full-text article views including HTML views, PDF and ePub downloads, according to the available data) and Abstracts Views on Vision4Press platform.
Data correspond to usage on the plateform after 2015. The current usage metrics is available 48-96 hours after online publication and is updated daily on week days.
Initial download of the metrics may take a while.