Fig. 3.
Download original image
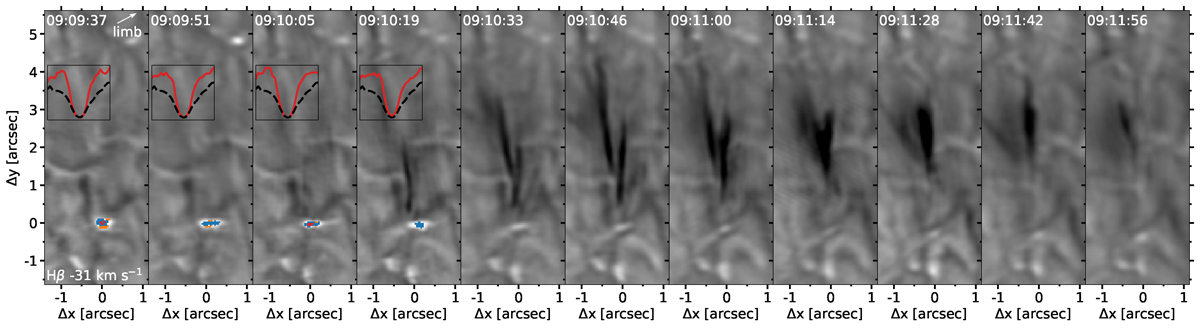
Example of spicules connected to a QSEB at their footpoint. The panels show a 2-minute sequence of H-beta blue wing images at half the cadence of the original data. The arrow in the upper right corner of the first panel shows the direction of the closest limb. The coloured pixels mark QSEB detections by the k-means model, following the colour scheme of Fig. 2. The small panel in the first four frames show the strongest QSEB profile per frame (solid red) and the background (dashed black). A movie of this event is available online.
Current usage metrics show cumulative count of Article Views (full-text article views including HTML views, PDF and ePub downloads, according to the available data) and Abstracts Views on Vision4Press platform.
Data correspond to usage on the plateform after 2015. The current usage metrics is available 48-96 hours after online publication and is updated daily on week days.
Initial download of the metrics may take a while.