Fig. 3
Download original image
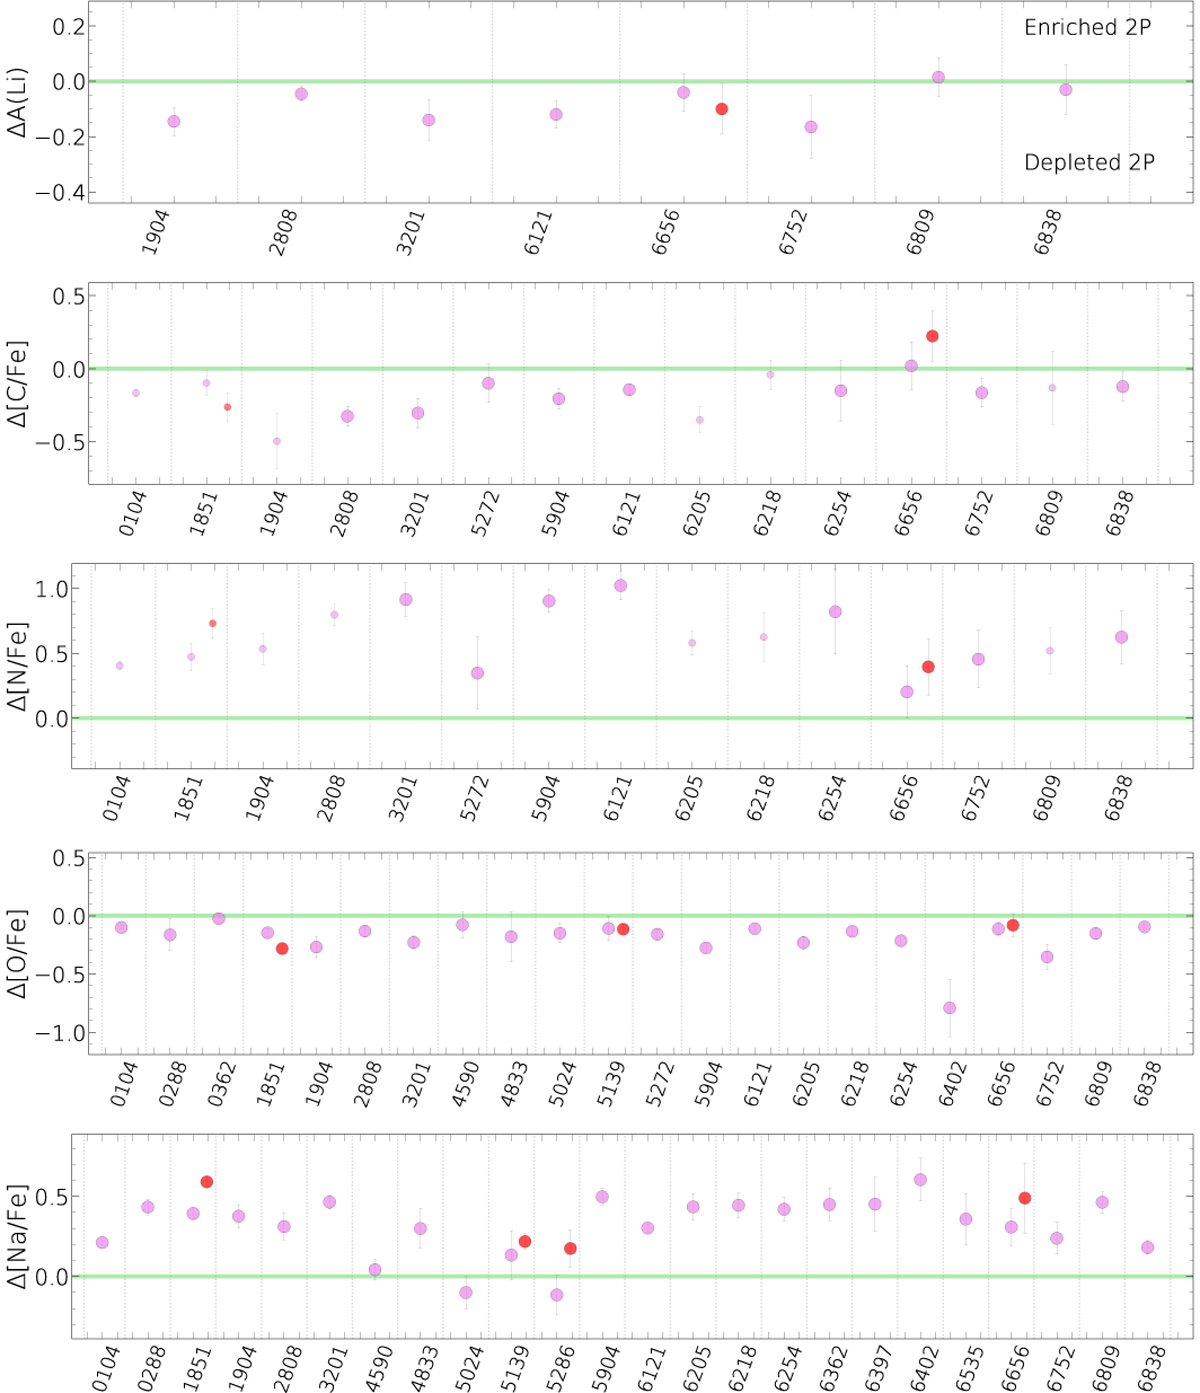
Differences in median abundances of A(Li), [C/Fe], [N/Fe], [O/Fe], and [Na/Fe] between 1P and 2P stars (violet) and 1P and anomalous (red) stars. The green lines separate the regime where 2P and anomalous stars are enriched or depleted (see text for details). The y-axis scale is adjusted in each plot to optimize clarity. The smaller dots indicate GCs where the Δ[C/Fe] and Δ[N/Fe] measurements are derived from RGB stars brighter than the bump.
Current usage metrics show cumulative count of Article Views (full-text article views including HTML views, PDF and ePub downloads, according to the available data) and Abstracts Views on Vision4Press platform.
Data correspond to usage on the plateform after 2015. The current usage metrics is available 48-96 hours after online publication and is updated daily on week days.
Initial download of the metrics may take a while.