Open Access
Fig. 13
Download original image
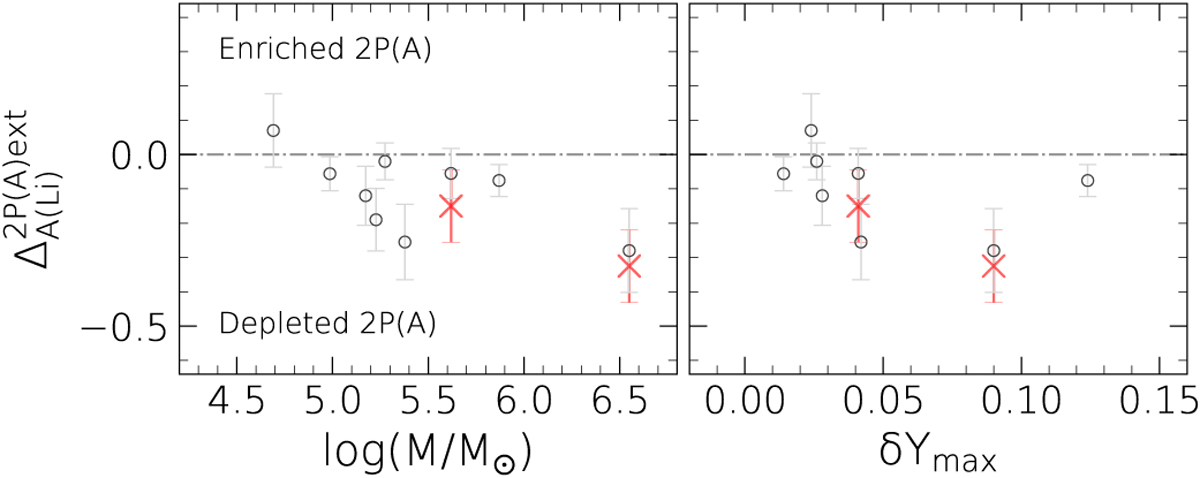
Difference between lithium abundances for the most extreme 2P stars and the 1P stars (open black dots) vs. the cluster mass and maximum helium spread (right and left panels, respectively). Red crosses indicate the same quantity but measured for anomalous stars (see text for details).
Current usage metrics show cumulative count of Article Views (full-text article views including HTML views, PDF and ePub downloads, according to the available data) and Abstracts Views on Vision4Press platform.
Data correspond to usage on the plateform after 2015. The current usage metrics is available 48-96 hours after online publication and is updated daily on week days.
Initial download of the metrics may take a while.