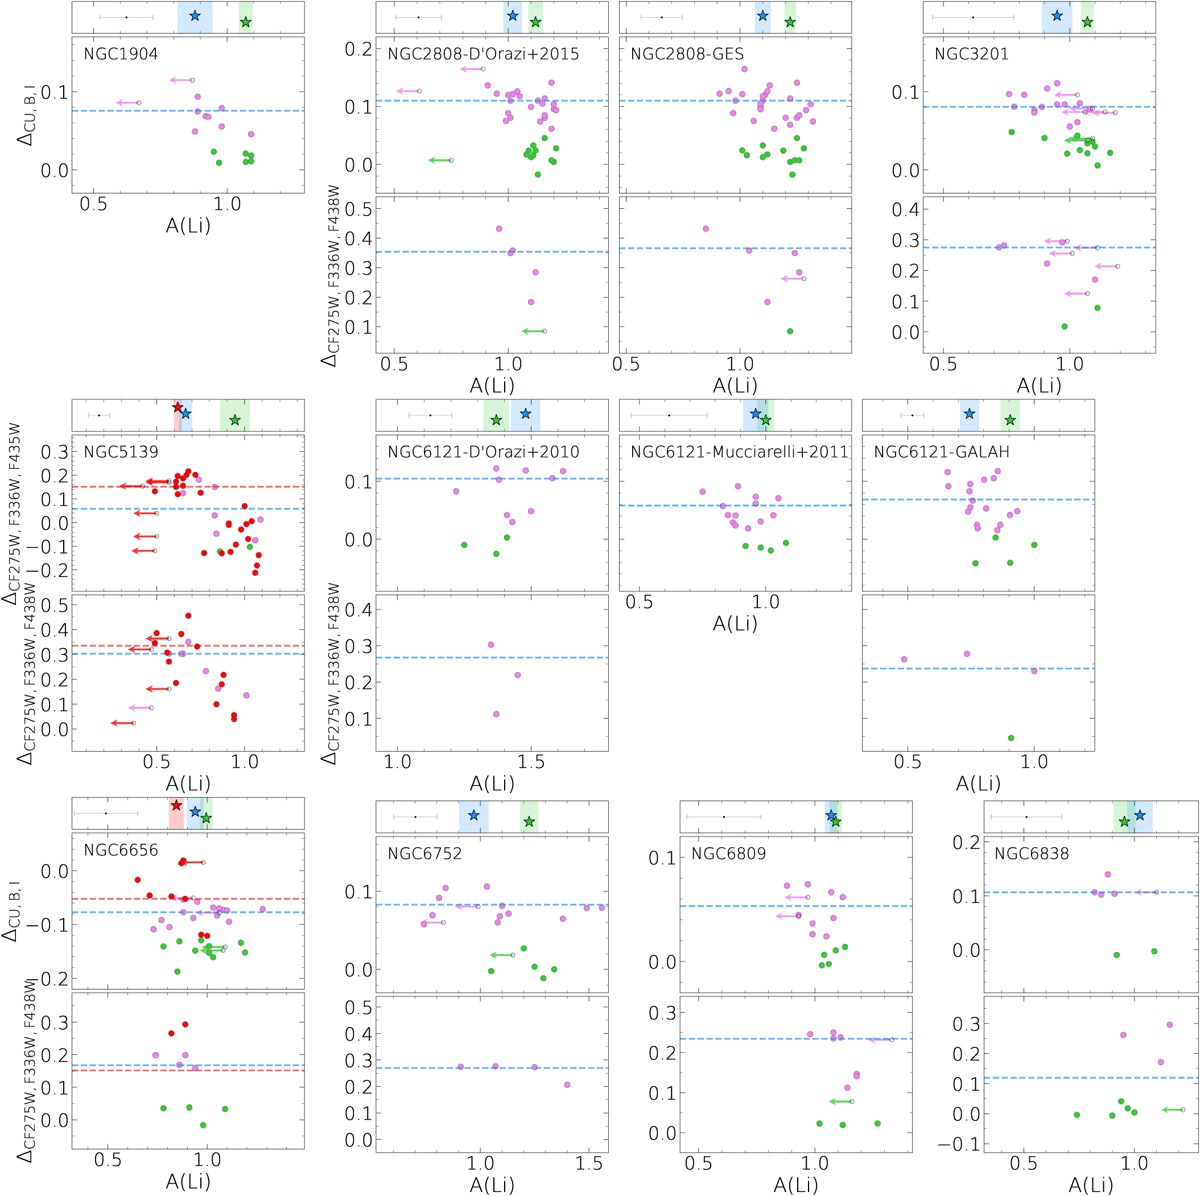
Fig. 12
Download original image
The y-axis of the ChM vs. A(Li). Measurements and upper limit (arrows) are color coded according to their population. For each GC, the bottom panel refers to stars in the innermost areas covered by HST observations, while the upper ChM regards stars outside the central field (covered by ground-based photometry in all GCs except ωCen). Horizontal blue and red dashed lines indicate the 70-th percentile level of the 1P+2P and 1P+anomalous star distributions, respectively. Above the ChMs, starred green and blue symbols denote the median 1P and 2Pext A(Li), shifted arbitrarily on the y-axis for illustration purposes.
Current usage metrics show cumulative count of Article Views (full-text article views including HTML views, PDF and ePub downloads, according to the available data) and Abstracts Views on Vision4Press platform.
Data correspond to usage on the plateform after 2015. The current usage metrics is available 48-96 hours after online publication and is updated daily on week days.
Initial download of the metrics may take a while.