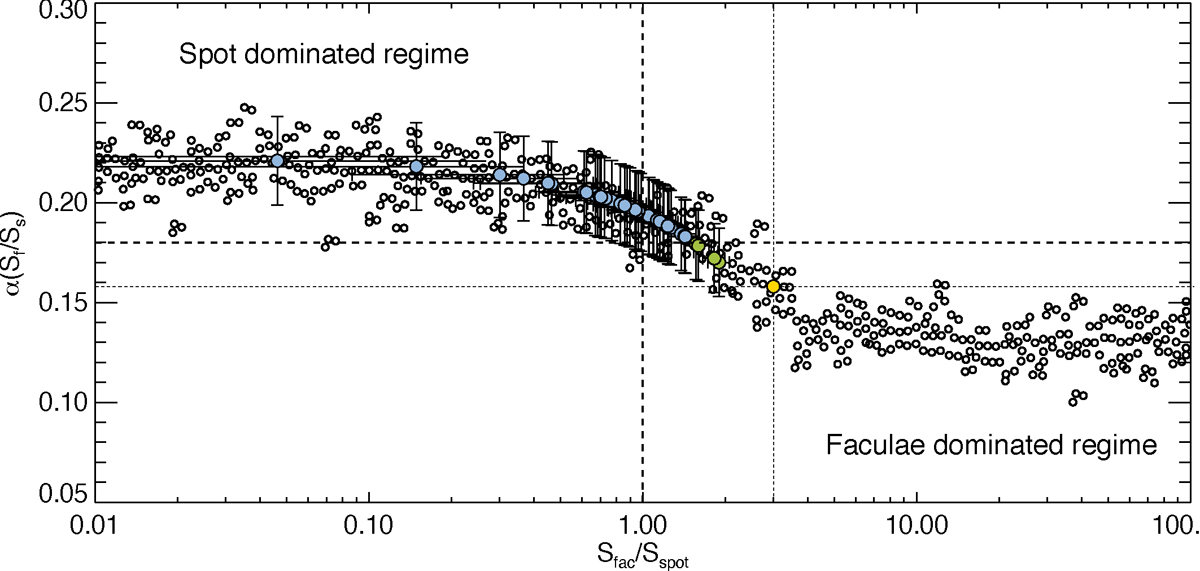
Fig. 3.
Download original image
Diagram of the α factor (parameter proportional to the instantaneous surface ratio between bright and dark features, Sfac/Sspot) for the 48 Kepler stars compared with values obtained for 400 modeled LCs with different Sfac/Sspot (adapted from Shapiro et al. 2020; Amazo-Gómez et al. 2020b). The Sun (yellow circle) is located in the transition region between the branches of spot-dominated surfaces (left) and faculae-dominated LCs (right). Blue circles represent the 48 stars analyzed with the GPS in this work, 4 of which are highlighted in green (i.e., KIC 3853938, KIC 8424356, KIC 11599385, and KIC 12266582) since they are transitioning between spot- and faculae-domination (i.e., GPS α<0.18, as indicated by the dashed black line). The dotted black lines correspond to solar values.
Current usage metrics show cumulative count of Article Views (full-text article views including HTML views, PDF and ePub downloads, according to the available data) and Abstracts Views on Vision4Press platform.
Data correspond to usage on the plateform after 2015. The current usage metrics is available 48-96 hours after online publication and is updated daily on week days.
Initial download of the metrics may take a while.