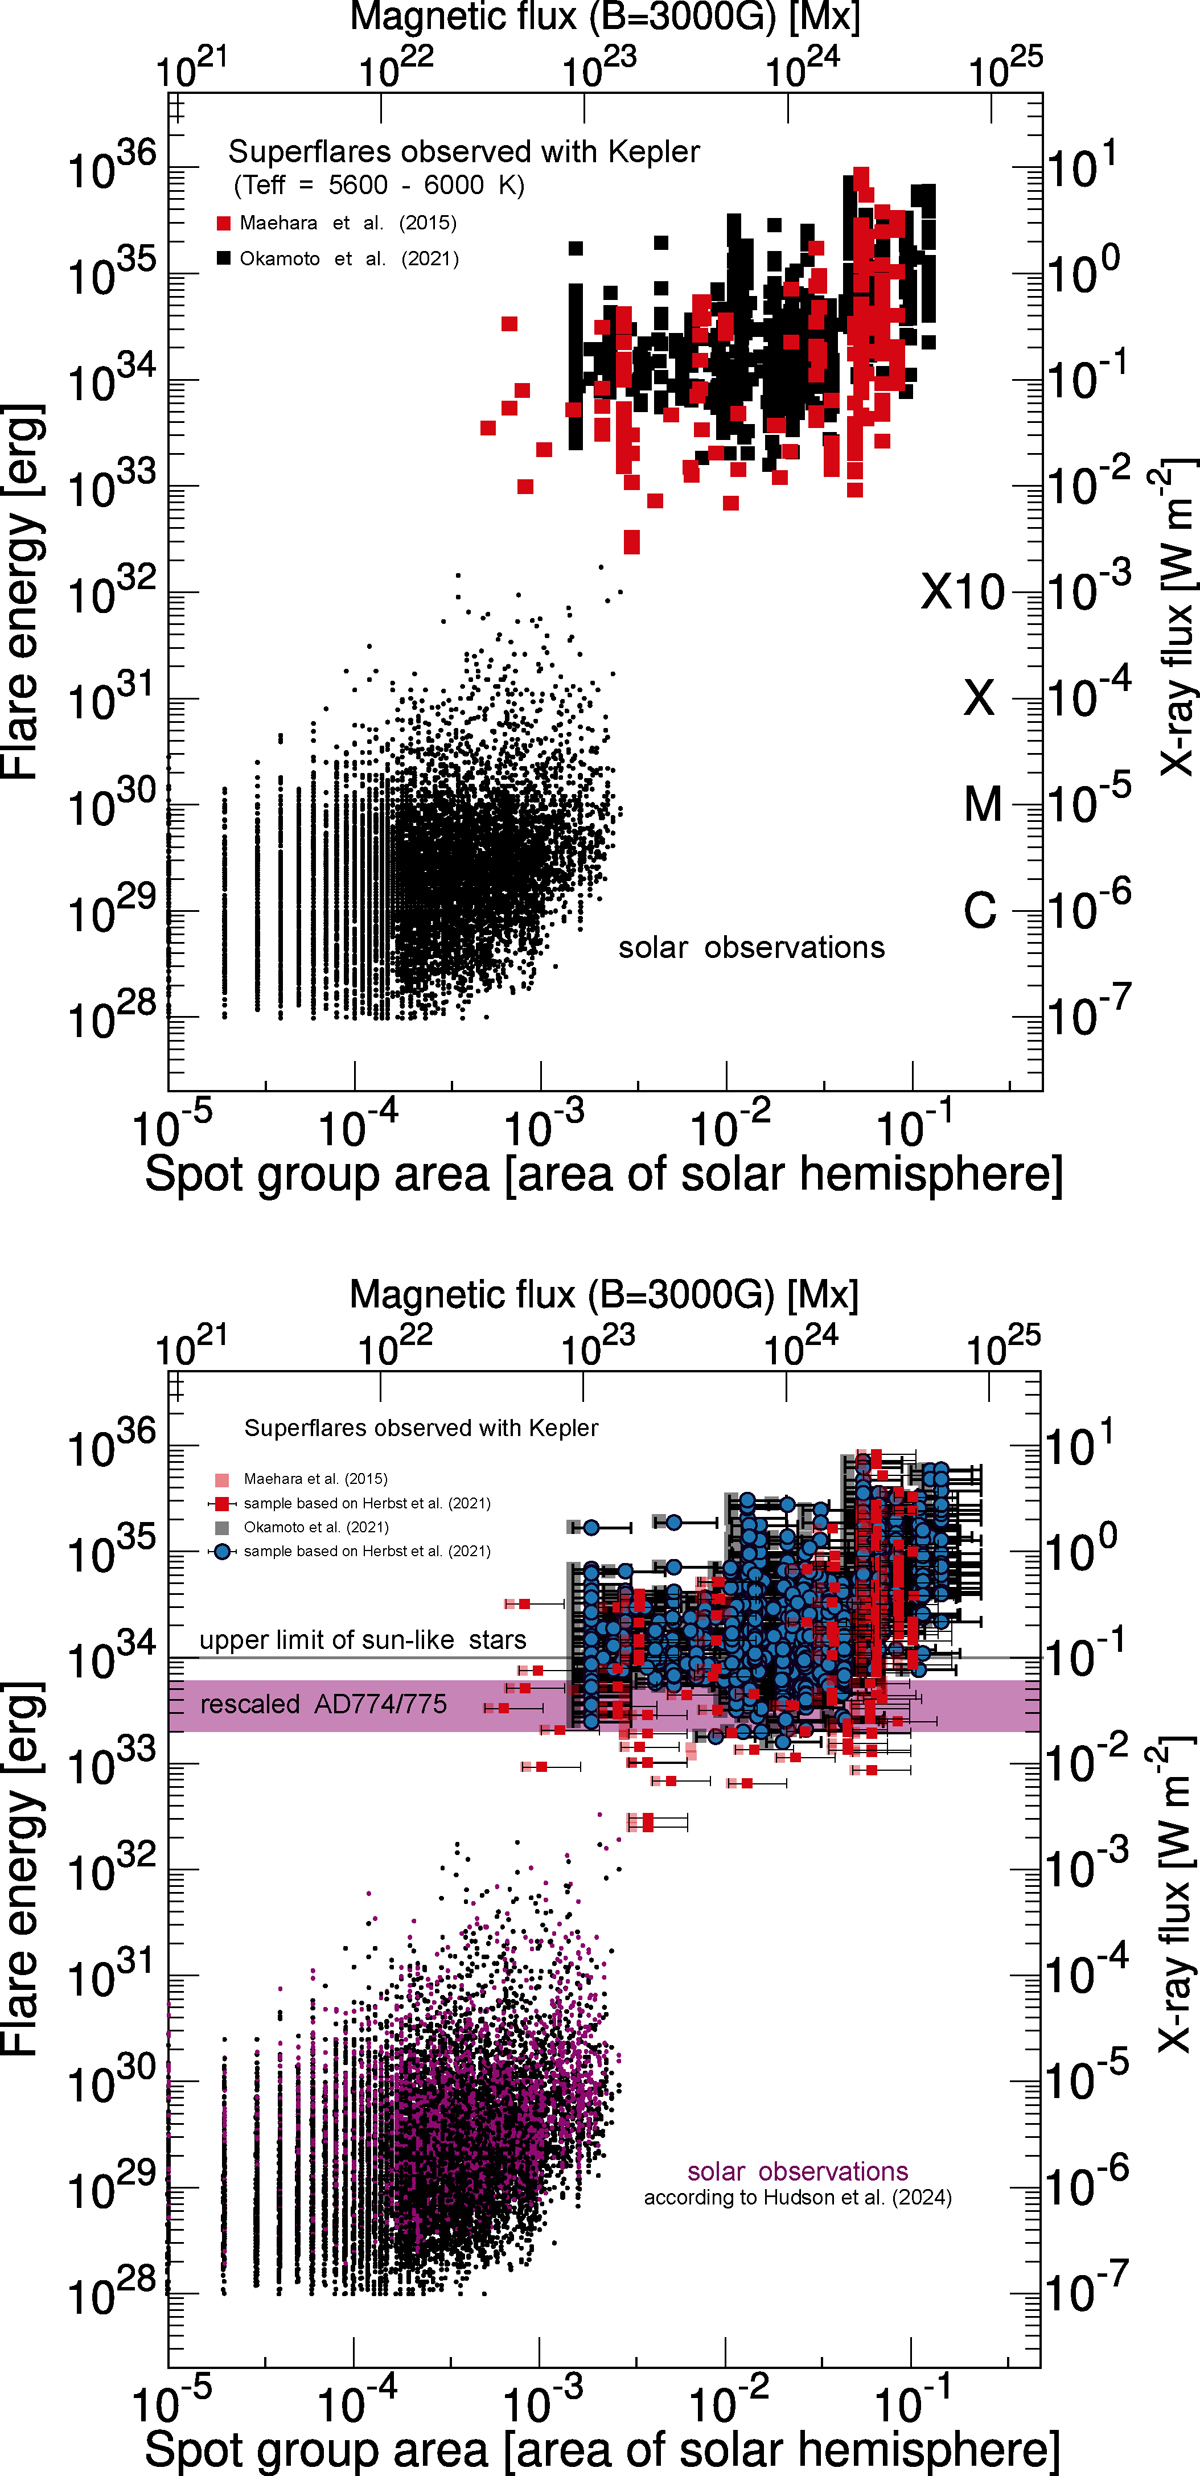
Fig. 1.
Download original image
Flare energy as a function of spot group area for solar flares (black dots) and superflares of G-type stars from the Kepler sample by Okamoto et al. (2021). Left panel: Original Sun-like sample from Okamoto et al. (2021). Right panel: Updated solar observations based on the rescaling discussed in Hudson et al. (2024) (purple dots) and updated stellar sample utilizing the updated spot group area function from Herbst et al. (2021) (blue dots and associated errors).
Current usage metrics show cumulative count of Article Views (full-text article views including HTML views, PDF and ePub downloads, according to the available data) and Abstracts Views on Vision4Press platform.
Data correspond to usage on the plateform after 2015. The current usage metrics is available 48-96 hours after online publication and is updated daily on week days.
Initial download of the metrics may take a while.