Open Access
Fig. 8.
Download original image
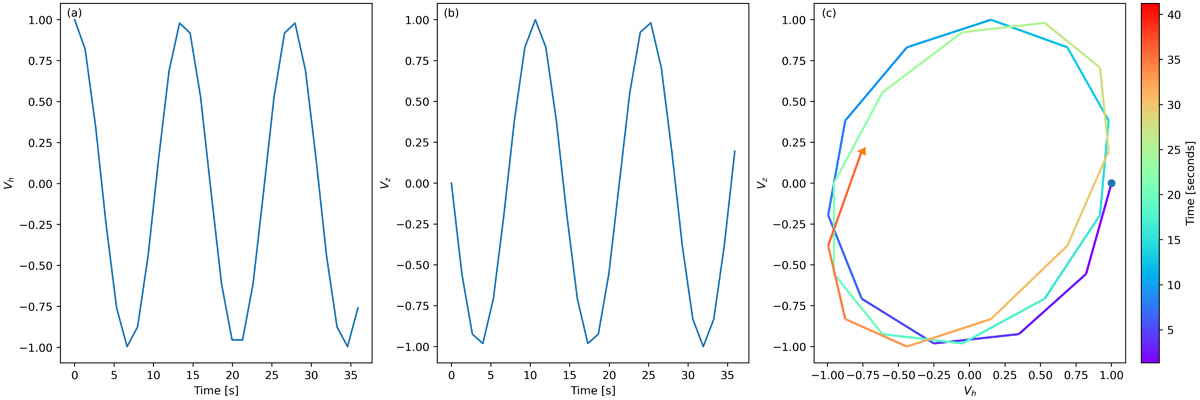
Filtered signal of the velocity oscillations. Panel (a) and (b) show the normalized PoS and LoS velocities to their maximum values, respectively. Panel (c) shows the hodogram where the colour represents the time. The starting point is denoted by the blue dot and the ending point is denoted by the red triangle.
Current usage metrics show cumulative count of Article Views (full-text article views including HTML views, PDF and ePub downloads, according to the available data) and Abstracts Views on Vision4Press platform.
Data correspond to usage on the plateform after 2015. The current usage metrics is available 48-96 hours after online publication and is updated daily on week days.
Initial download of the metrics may take a while.