Fig. 6.
Download original image
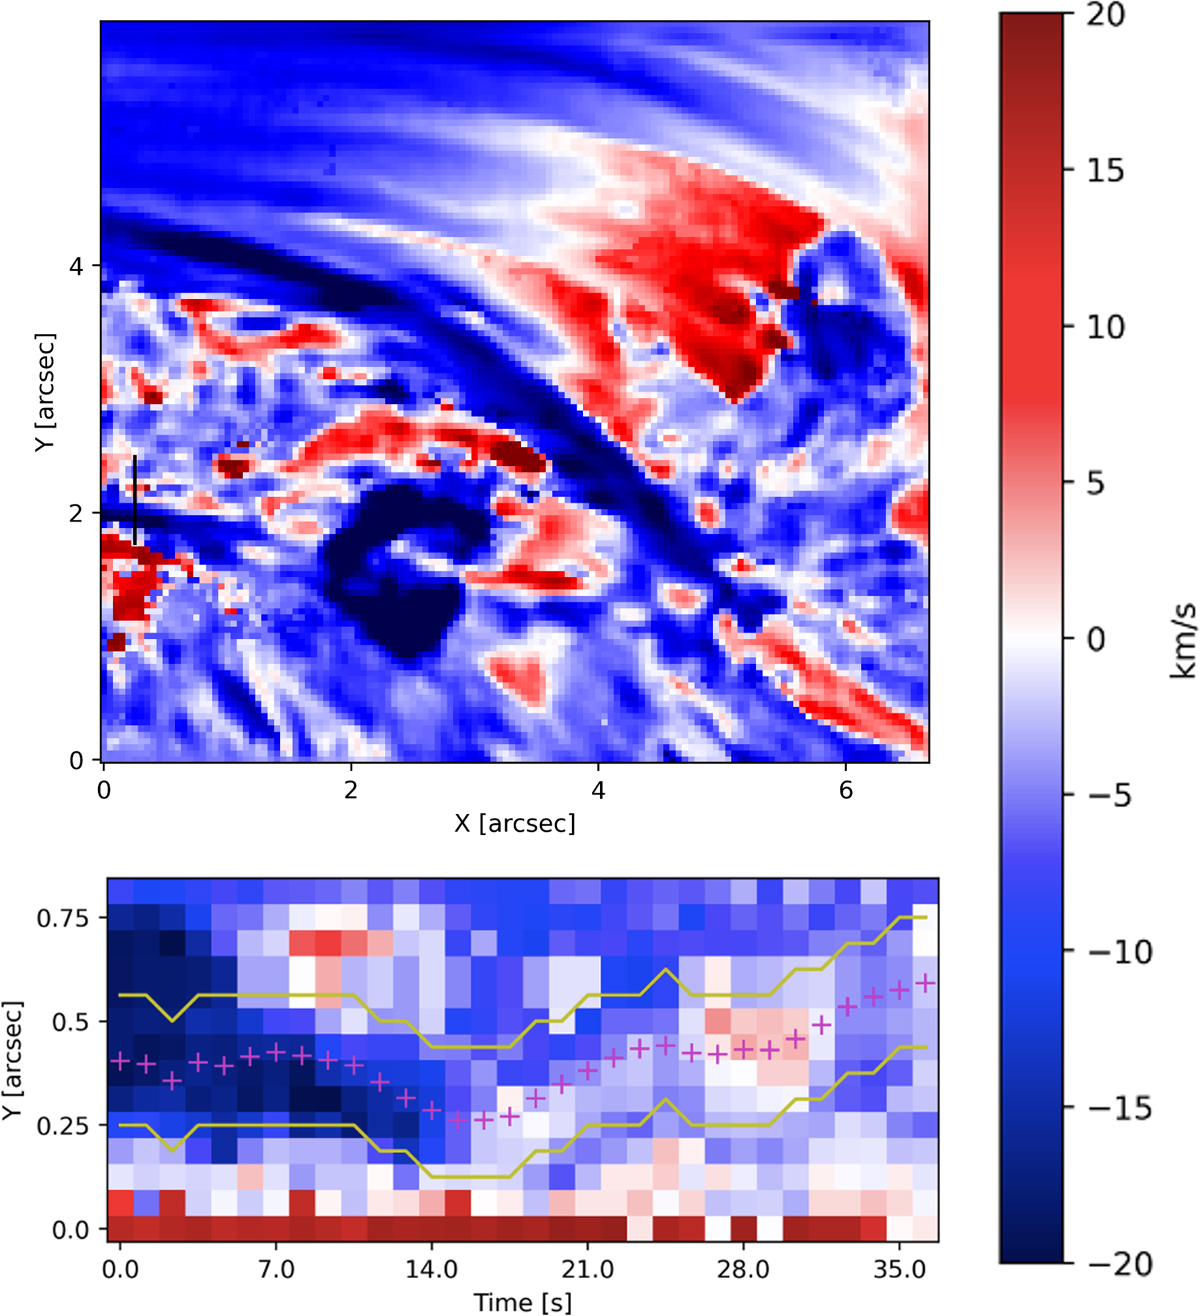
Doppler maps of the detected transverse oscillations. The upper panel shows the Doppler velocity map obtained using the bisector method. The black line shows the location of the pseudo-slit (same as in Fig. 4) that is used to construct the Doppler time-distance map shown in the lower panel. Magenta crosses show the fibril position as obtained from the intensity map and yellow curves outline the fibril.
Current usage metrics show cumulative count of Article Views (full-text article views including HTML views, PDF and ePub downloads, according to the available data) and Abstracts Views on Vision4Press platform.
Data correspond to usage on the plateform after 2015. The current usage metrics is available 48-96 hours after online publication and is updated daily on week days.
Initial download of the metrics may take a while.