Open Access
Fig. 5.
Download original image
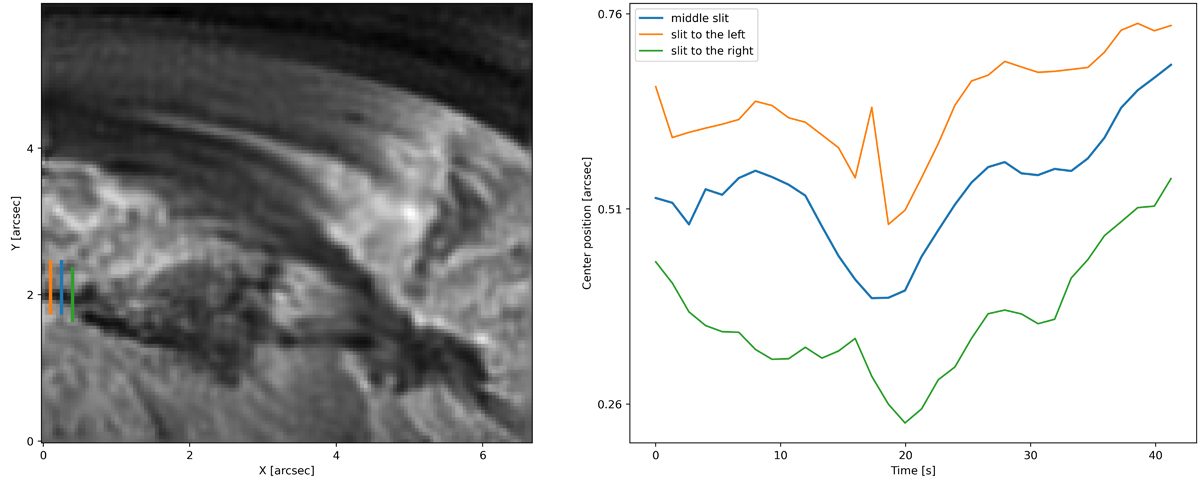
Investigation of the propagation of the wave. The left panel shows the Hα line core image, with the location of three pseudo-slits across the fibril. The right panel shows the detected centre positions of the fibril, with colours corresponding to the pseudo-slit used to construct the time-distance map.
Current usage metrics show cumulative count of Article Views (full-text article views including HTML views, PDF and ePub downloads, according to the available data) and Abstracts Views on Vision4Press platform.
Data correspond to usage on the plateform after 2015. The current usage metrics is available 48-96 hours after online publication and is updated daily on week days.
Initial download of the metrics may take a while.