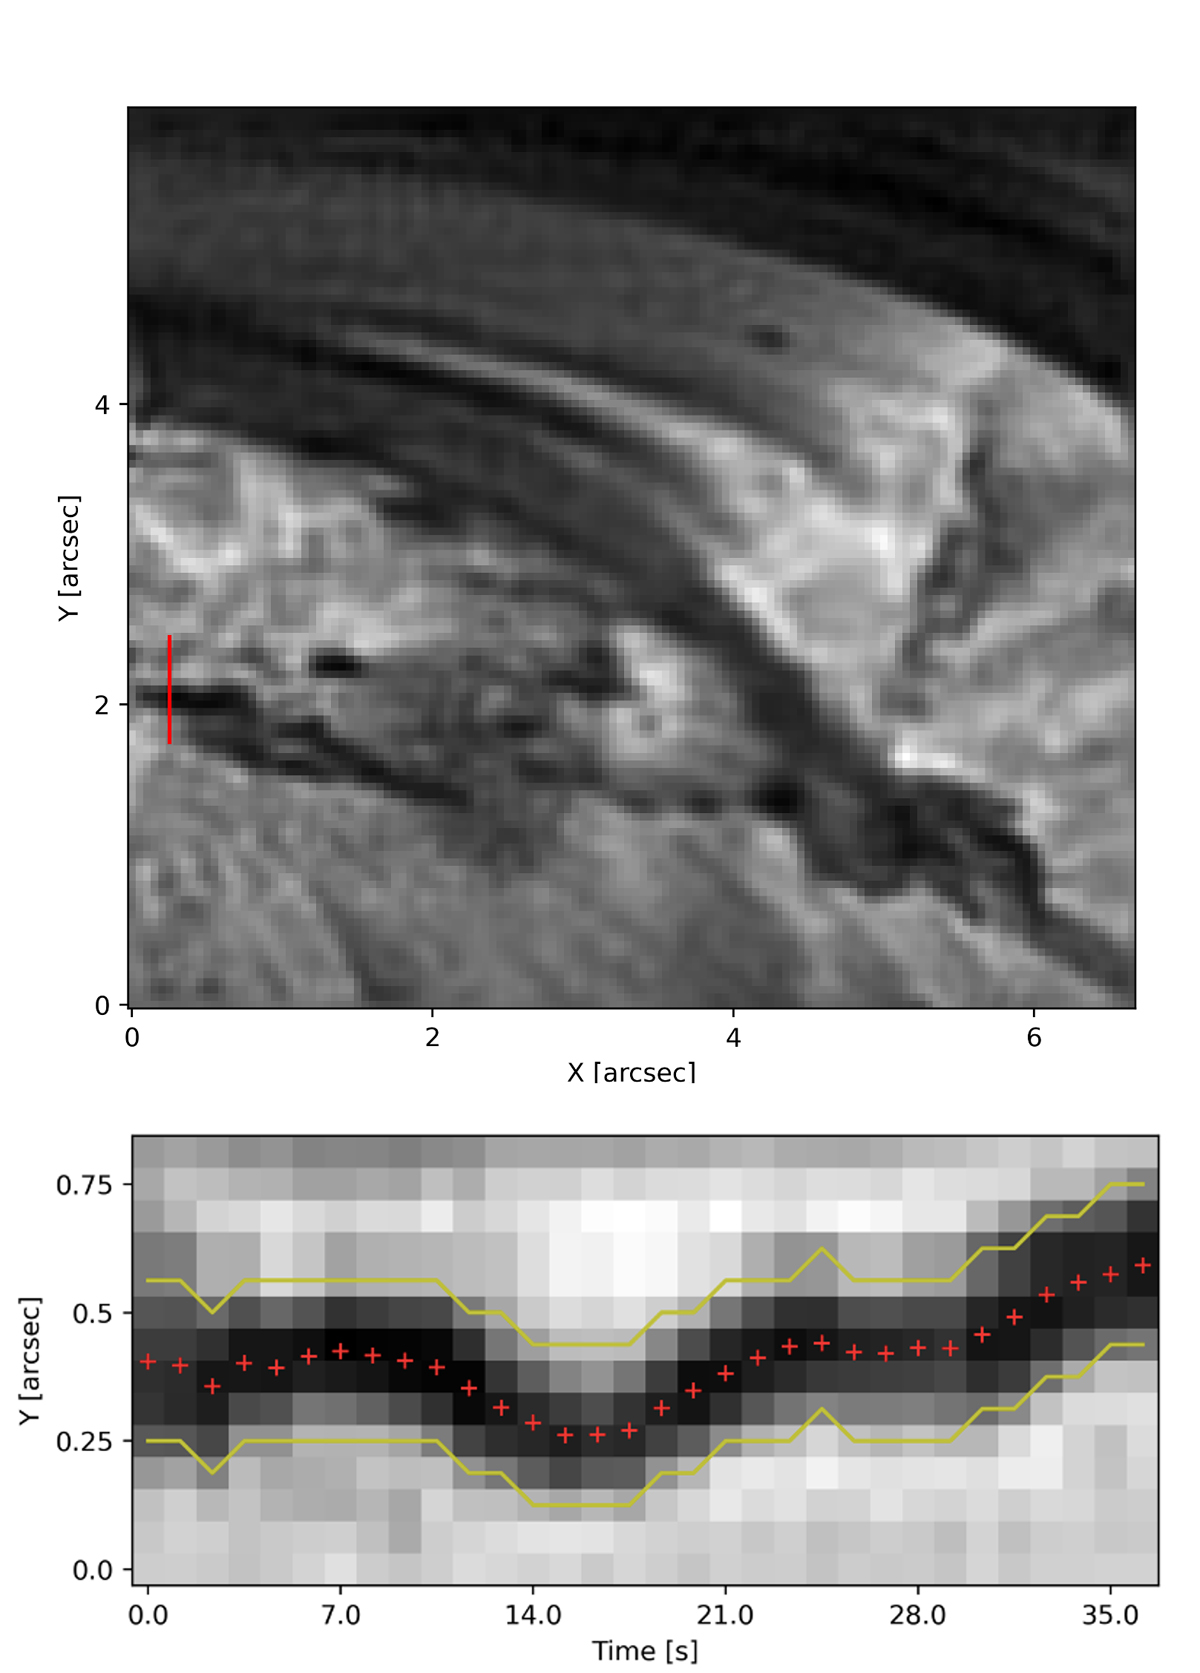
Fig. 4.
Download original image
Intensity maps of the detected transverse oscillations. The upper panel shows the Hα line core image, where the location of the pseudo-slit is denoted by the red line. The lower panel shows the time-distance map constructed using the red pseudo-slit. Red crosses show the centroid positions obtained through Gaussian fitting, while yellow curves show the fibril contour with a width of 5 pixels.
Current usage metrics show cumulative count of Article Views (full-text article views including HTML views, PDF and ePub downloads, according to the available data) and Abstracts Views on Vision4Press platform.
Data correspond to usage on the plateform after 2015. The current usage metrics is available 48-96 hours after online publication and is updated daily on week days.
Initial download of the metrics may take a while.