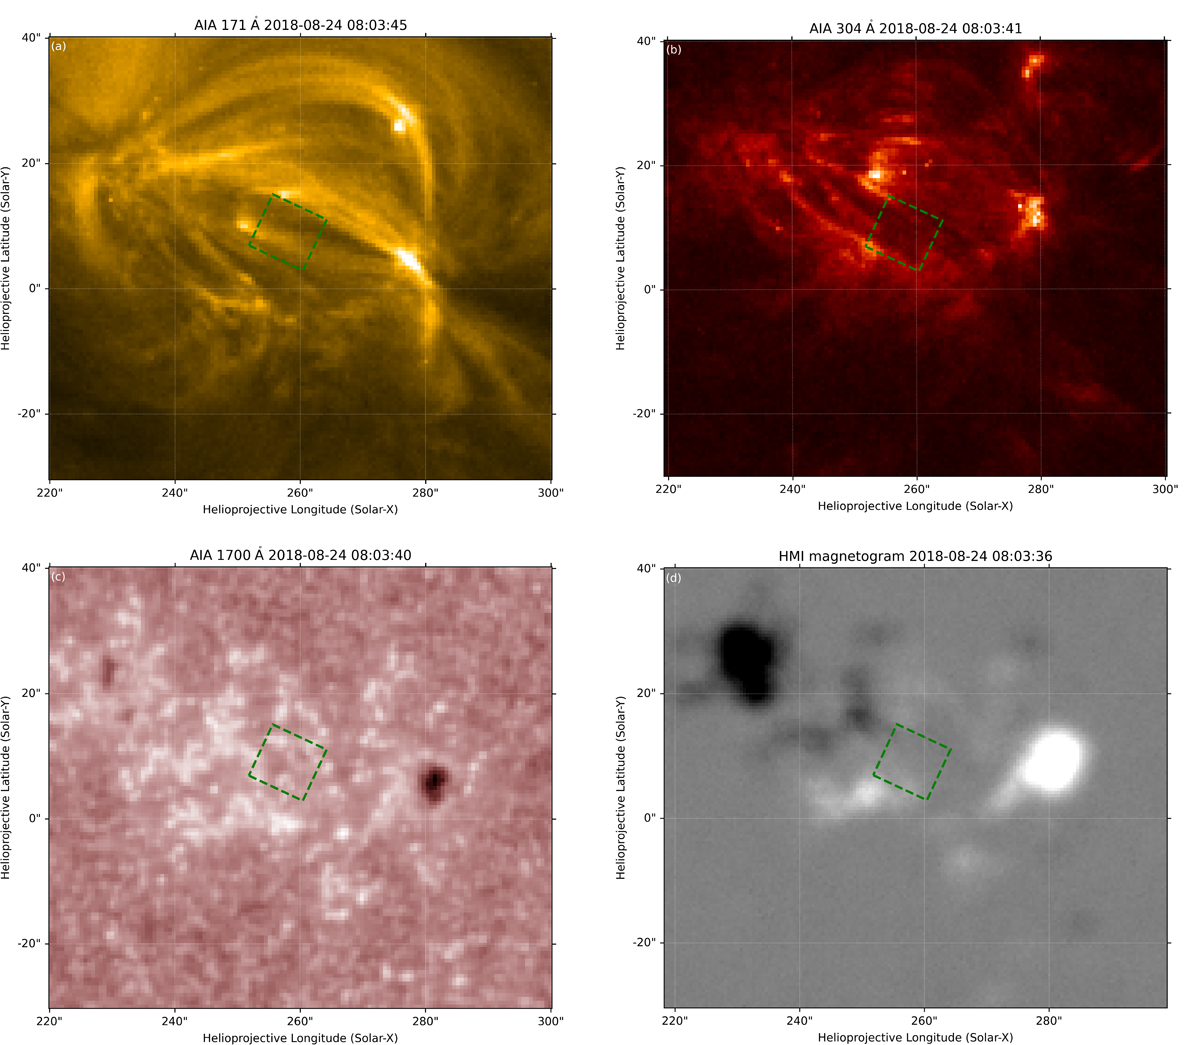
Fig. 2.
Download original image
AR 12720 as observed by the Solar Dynamics Observatory (SDO). Panels (a) to (c) show images in the 171 Å, 304 Å, and 1700 Å channels. Panel (d) shows the LoS magnetic field in the photosphere obtained with the HMI. The green rectangle shows the field of vision (FoV) of MiHI. The resolution of the HMI magnetogram was reduced to match the Atmospheric Imaging Assembly (AIA) plate scale.
Current usage metrics show cumulative count of Article Views (full-text article views including HTML views, PDF and ePub downloads, according to the available data) and Abstracts Views on Vision4Press platform.
Data correspond to usage on the plateform after 2015. The current usage metrics is available 48-96 hours after online publication and is updated daily on week days.
Initial download of the metrics may take a while.