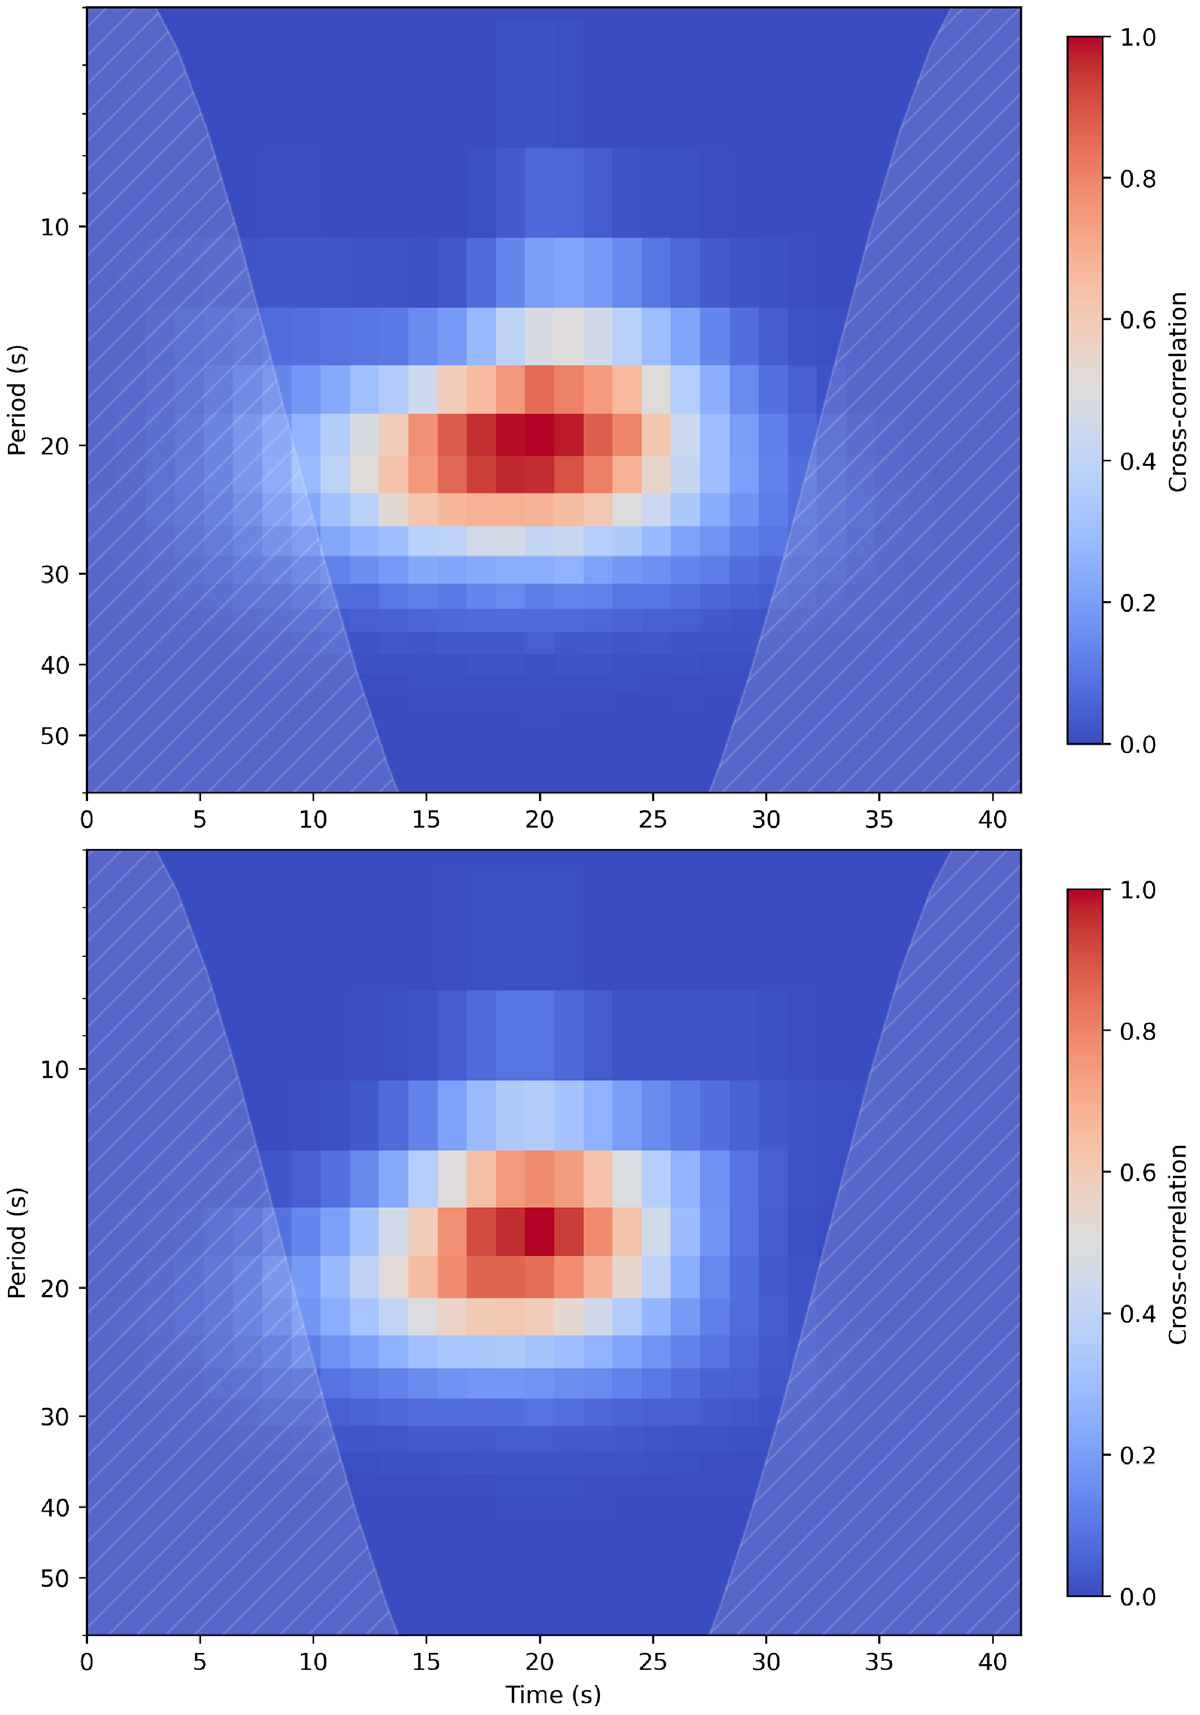
Fig. B.1.
Download original image
The cross-wavelet correlation between two transverse motions is shown. The upper panel displays the cross-correlation between the middle slit and the slit to its left, while the lower panel shows the cross-correlation between the middle slit and the slit to its right. Red indicates regions of maximum significance, while blue represents regions of minimum significance.
Current usage metrics show cumulative count of Article Views (full-text article views including HTML views, PDF and ePub downloads, according to the available data) and Abstracts Views on Vision4Press platform.
Data correspond to usage on the plateform after 2015. The current usage metrics is available 48-96 hours after online publication and is updated daily on week days.
Initial download of the metrics may take a while.