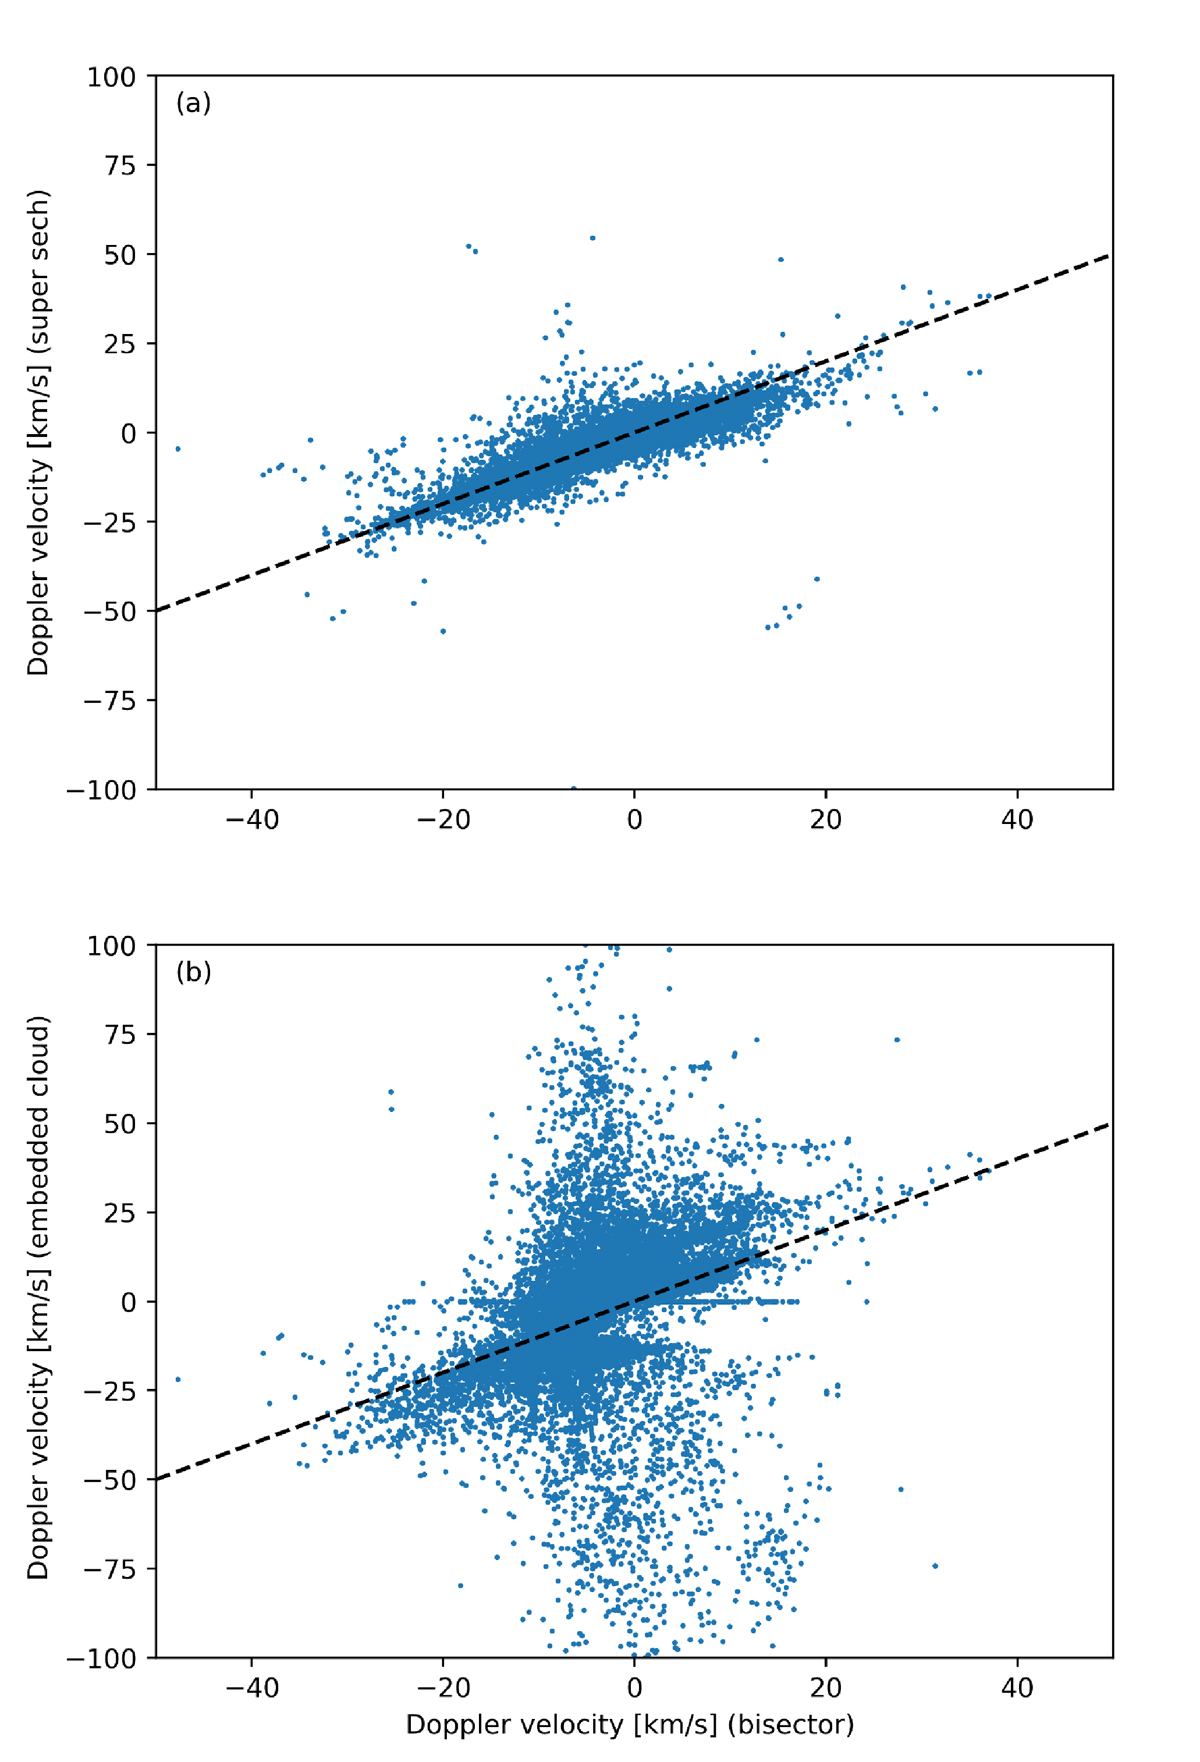
Fig. A.4.
Download original image
Correlation plots of Doppler velocities of the first frame of the image sequences obtained using different methods. Panel (a) shows Doppler velocities obtained using bisector method plotted against velocities obtained using super-sech fit. Panel (b) shows Doppler velocities obtained using bisector method plotted against velocities derived using embedded cloud model. In both panels the black dashed line shows x = y line.
Current usage metrics show cumulative count of Article Views (full-text article views including HTML views, PDF and ePub downloads, according to the available data) and Abstracts Views on Vision4Press platform.
Data correspond to usage on the plateform after 2015. The current usage metrics is available 48-96 hours after online publication and is updated daily on week days.
Initial download of the metrics may take a while.