Open Access
Fig. A.3.
Download original image
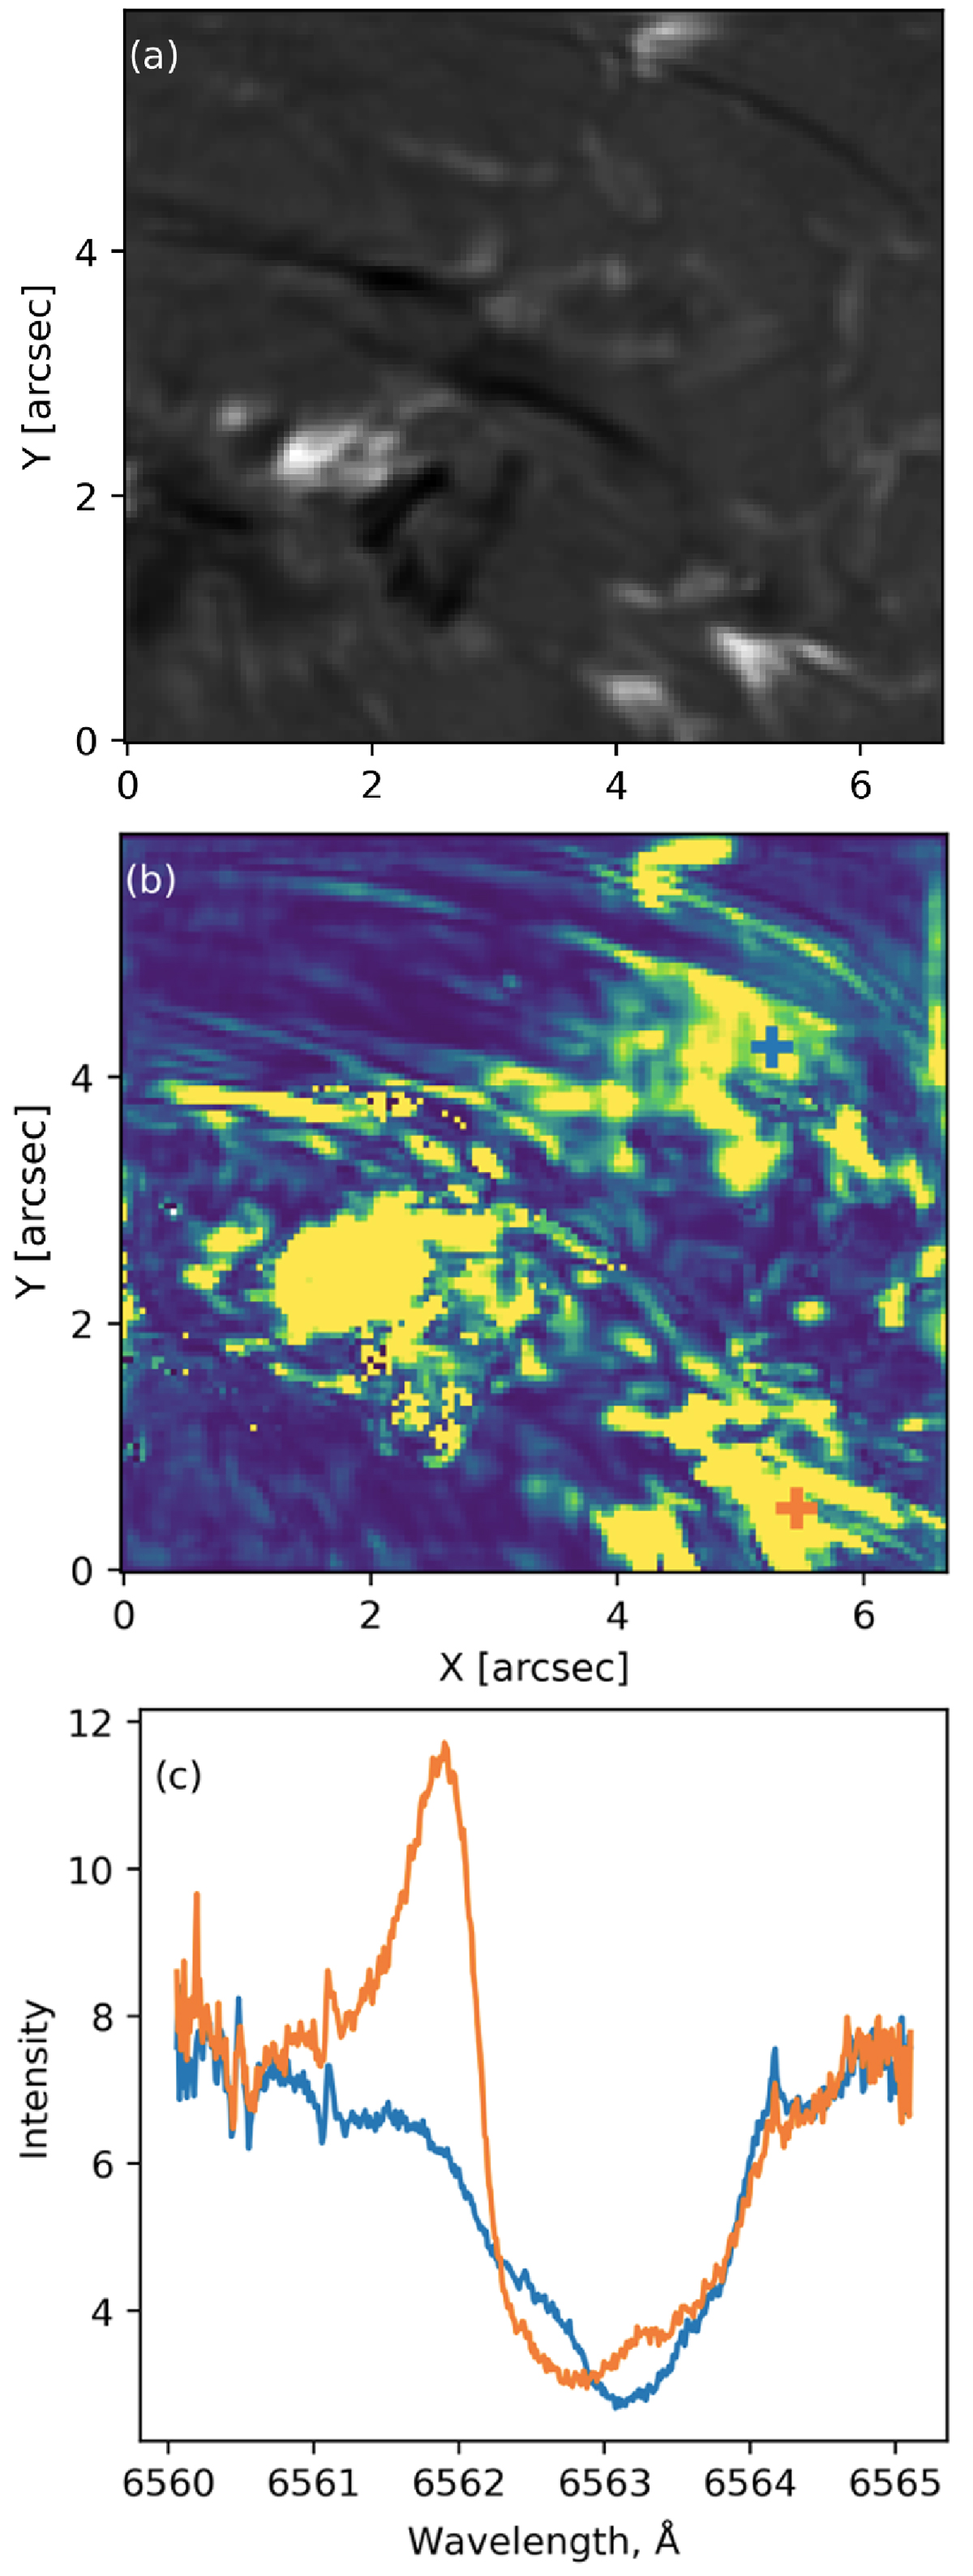
Panel (a) shows the intensity map taken at the blue wing position of Hα. Panel (b) shows the χ2-error map of the super-sech fit. Blue and orange crosses show the locations of pixels which spectra are shown on panel (c) where colour of the curve corresponds to the colour of the cross.
Current usage metrics show cumulative count of Article Views (full-text article views including HTML views, PDF and ePub downloads, according to the available data) and Abstracts Views on Vision4Press platform.
Data correspond to usage on the plateform after 2015. The current usage metrics is available 48-96 hours after online publication and is updated daily on week days.
Initial download of the metrics may take a while.