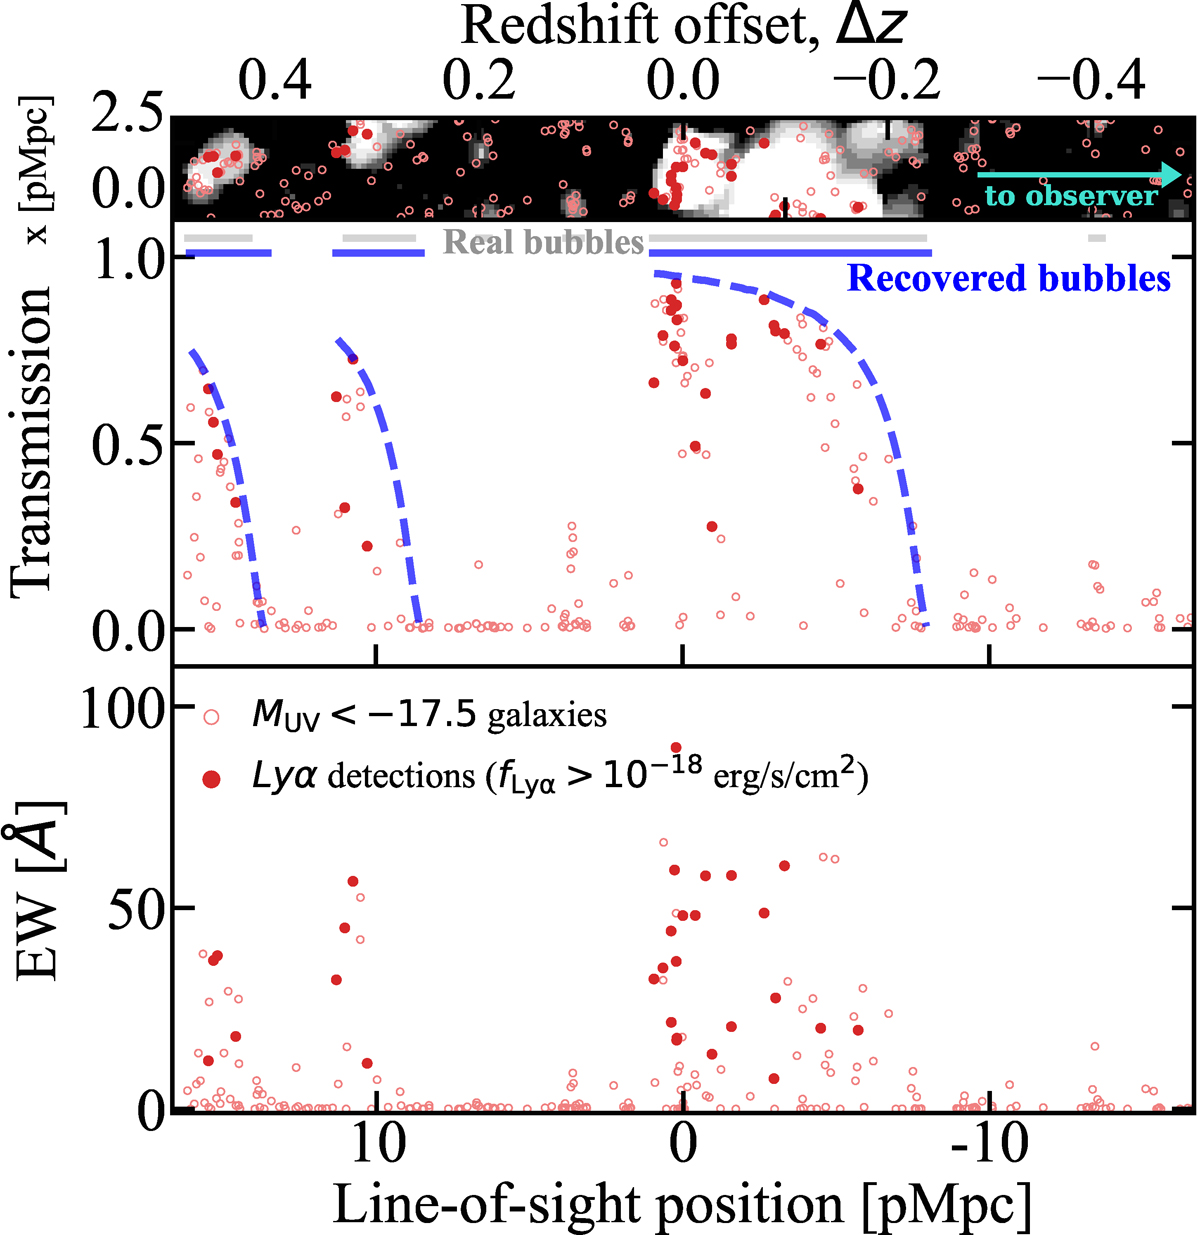
Fig. 6.
Download original image
Example sightline skewer showing galaxies’ Lyα transmissions and EW as a function of the LOS position, where the zero point of the LOS position is arbitrary. The top panel shows the ionization map in the x−z plane (white ionized, black neutral gas). Red empty and solid dots are galaxies with MUV>−17.5 in the slice. Red solid points are galaxies with fLyα>10−18 erg/s/cm2. The middle panel shows the Lyα transmission for each galaxy as a function of LOS position. Galaxies in bubbles show high transmission while galaxies in neutral IGM having transmission ≈0. Horizontal Gray lines show the spans of the simulated ionized bubbles along the sightline. Blue dashed lines are the 𝒯(dIGM) curves derived using the damping wing optical depth (Figure 5), galaxy transmissions follow this curve very well. The blue horizontal lines show the span of the recovered bubbles using our method (Section 4.1). The bottom panel shows the observed Lyα EW of the galaxies, highlighting that strong Lyα EW ≳ 50 Å likely signpost large ionized regions.
Current usage metrics show cumulative count of Article Views (full-text article views including HTML views, PDF and ePub downloads, according to the available data) and Abstracts Views on Vision4Press platform.
Data correspond to usage on the plateform after 2015. The current usage metrics is available 48-96 hours after online publication and is updated daily on week days.
Initial download of the metrics may take a while.