Fig. 5.
Download original image
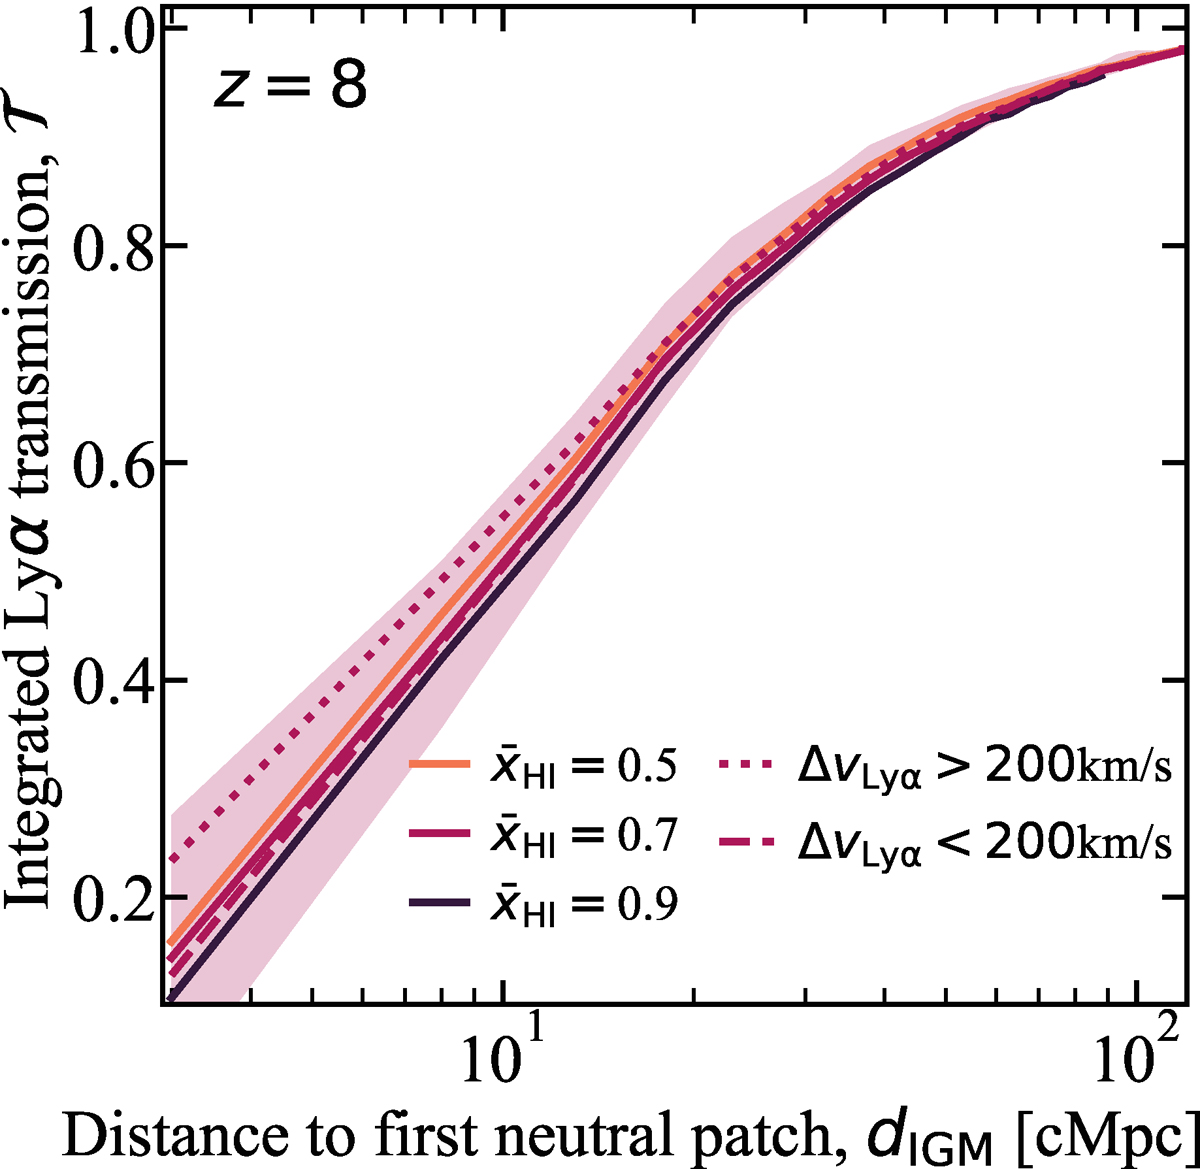
Integrated Lyα transmission as a function of the distance between a galaxy and the first neutral IGM patch the galaxy light encounters at z = 8. Solid lines in orange, maroon, and black curves show 𝒯(dIGM) for all the galaxies at ![]() , 0.7, 0.9, respectively. The shaded region shows the 16−84 percentile range of the
, 0.7, 0.9, respectively. The shaded region shows the 16−84 percentile range of the ![]() curve, for dIGM>10, the 16−84 percentile range is Δ𝒯 < 0.1. Maroon dashed and dotted lines show 𝒯(dIGM) at
curve, for dIGM>10, the 16−84 percentile range is Δ𝒯 < 0.1. Maroon dashed and dotted lines show 𝒯(dIGM) at ![]() , made using galaxies with emitted Lyα velocity offsets ΔvLyα>200 km/s and ΔvLyα<200 km/s respectively. None of these curves differ significantly, meaning 𝒯(dIGM) does not depend strongly on
, made using galaxies with emitted Lyα velocity offsets ΔvLyα>200 km/s and ΔvLyα<200 km/s respectively. None of these curves differ significantly, meaning 𝒯(dIGM) does not depend strongly on ![]() or ΔvLyα, especially for dIGM>10 cMpc. The curves are for z = 8 only, but the qualitative trends hold at other z.
or ΔvLyα, especially for dIGM>10 cMpc. The curves are for z = 8 only, but the qualitative trends hold at other z.
Current usage metrics show cumulative count of Article Views (full-text article views including HTML views, PDF and ePub downloads, according to the available data) and Abstracts Views on Vision4Press platform.
Data correspond to usage on the plateform after 2015. The current usage metrics is available 48-96 hours after online publication and is updated daily on week days.
Initial download of the metrics may take a while.