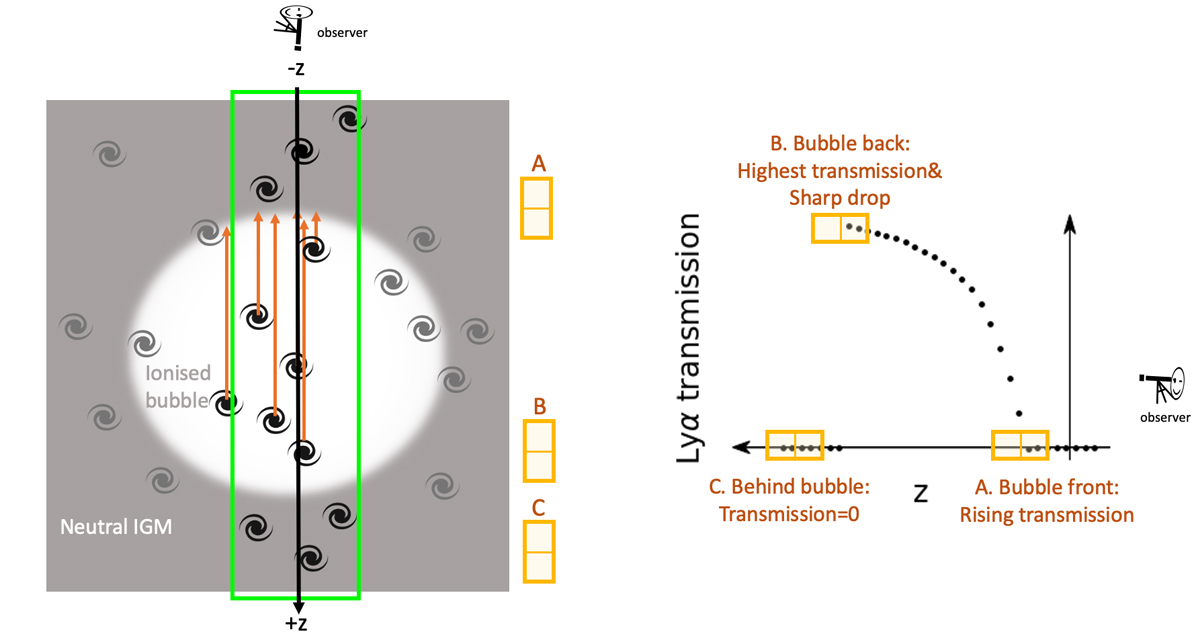
Fig. 4.
Download original image
Cartoon illustrating the transmission profile of galaxies along the LOS direction around a bubble. Left: Galaxies in and around a spherical bubble. Right: The integrated Lyα transmissions as a function of the LOS distance (d) measured using galaxies in the green box in the left panel. Transmission profiles (T)(z) viewed in different windows (A, B, and C) are different. Window A: Galaxies in front of the bubble are in fully neutral gas and thus experience a strong Lyα damping wing and have almost zero transmission. Stepping back into the bubble the transmission increases because of the increased path length of ionized IGM in front of galaxies. Window B: Galaxies located at the back of the bubble have the highest transmission because they have the longest path length through the ionized IGM. Window C: Galaxies on the far side of the bubble are in fully neutral IGM and have almost zero transmission. Galaxies’ integrated Lyα transmission is tightly correlated with the distance between the galaxy and the nearest neutral IGM patch along the LOS. We can use this correlation to map ionized regions along the LOS (Section 4).
Current usage metrics show cumulative count of Article Views (full-text article views including HTML views, PDF and ePub downloads, according to the available data) and Abstracts Views on Vision4Press platform.
Data correspond to usage on the plateform after 2015. The current usage metrics is available 48-96 hours after online publication and is updated daily on week days.
Initial download of the metrics may take a while.