Fig. 3.
Download original image
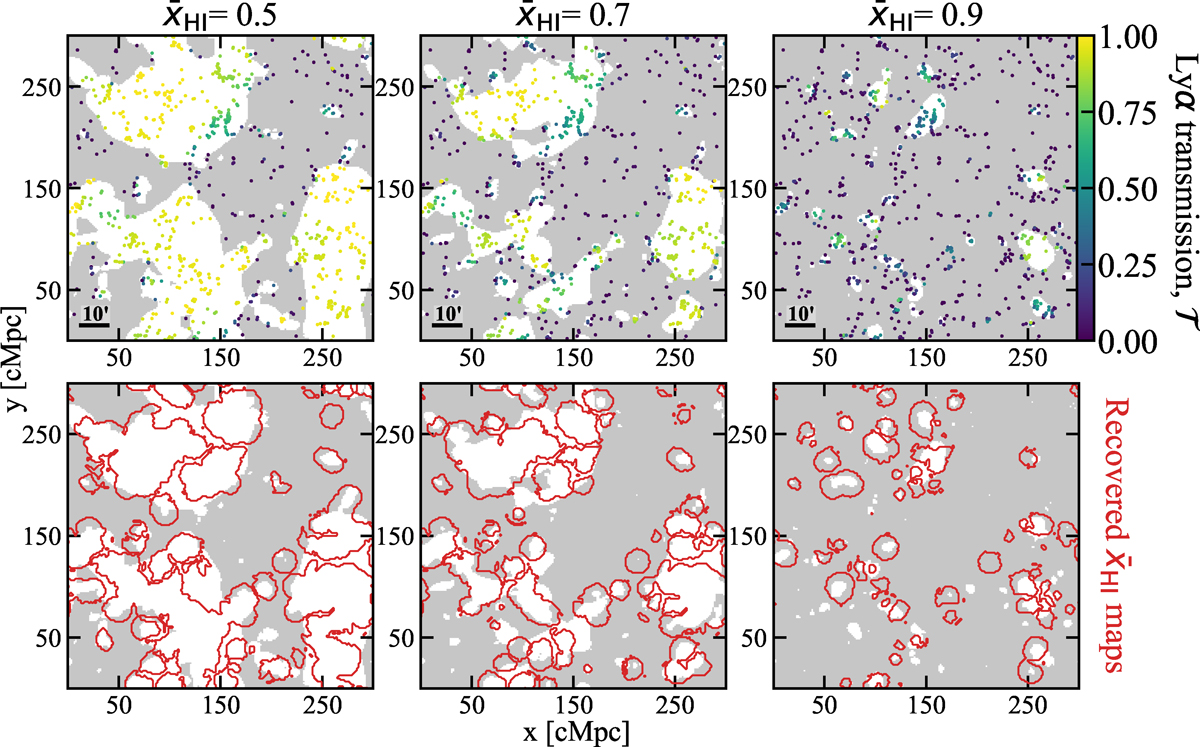
Top panels: Ionization maps and galaxies colored by their Lyα transmissions, at ![]() , 0.7, and 0.9 for our z = 8 simulation. Lower panels: Recovered bubble edges (red contours) using the approach described in Section 3 and Appendix A.1 on top of the input ionization maps (white – ionized, gray – neutral). For our mock observations we use a number density of ngal = 0.002/cMpc3 (corresponding to a detection limit of MUV<−17.8 at z = 8) and a Lyα 5σ equivalent width limit of ≥30 Å for the faintest galaxies. We see the bubble edges are recovered well at all neutral fractions.
, 0.7, and 0.9 for our z = 8 simulation. Lower panels: Recovered bubble edges (red contours) using the approach described in Section 3 and Appendix A.1 on top of the input ionization maps (white – ionized, gray – neutral). For our mock observations we use a number density of ngal = 0.002/cMpc3 (corresponding to a detection limit of MUV<−17.8 at z = 8) and a Lyα 5σ equivalent width limit of ≥30 Å for the faintest galaxies. We see the bubble edges are recovered well at all neutral fractions.
Current usage metrics show cumulative count of Article Views (full-text article views including HTML views, PDF and ePub downloads, according to the available data) and Abstracts Views on Vision4Press platform.
Data correspond to usage on the plateform after 2015. The current usage metrics is available 48-96 hours after online publication and is updated daily on week days.
Initial download of the metrics may take a while.