Fig. B.2.
Download original image
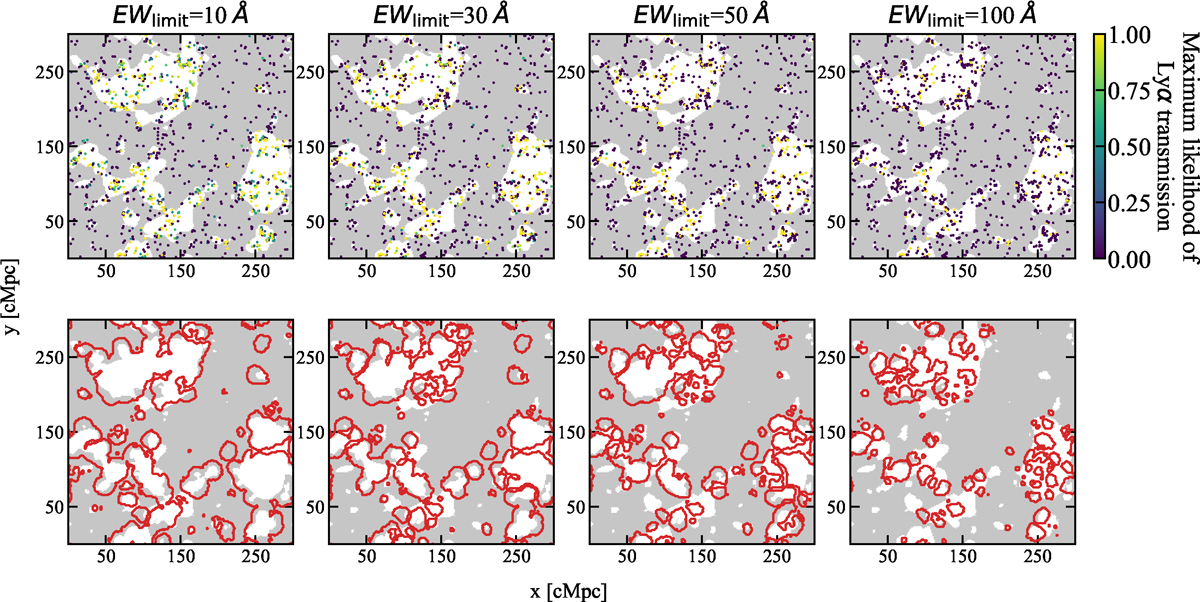
Upper panel: Input ionization map (gray neutral, white ionized) at ![]() and MUV≤-17.2 galaxies (dots) used to calculate asymmetry maps at z = 8. Galaxies are color-coded by their peak Lyα transmission (𝒯) inferred from the observed EW and uncertainty of EW. From left to right we show results using 5σ EW limit, EWLyα, limit = 10, 30, 50, and 100 Å for the faintest galaxies. Lower panel: Asymmetry maps (red contours) made using the galaxies in the upper panel. We can recover bubble edges very well when EWLyα, limit is at least the median emergent EW of galaxies (≈30 Å). When EWLyα, limit is too shallow (≫30 Å), we cannot get useful information about Lyα transmission from our observations, thus the recovered bubbles only trace the regions around galaxies with EW greater than the detection limit.
and MUV≤-17.2 galaxies (dots) used to calculate asymmetry maps at z = 8. Galaxies are color-coded by their peak Lyα transmission (𝒯) inferred from the observed EW and uncertainty of EW. From left to right we show results using 5σ EW limit, EWLyα, limit = 10, 30, 50, and 100 Å for the faintest galaxies. Lower panel: Asymmetry maps (red contours) made using the galaxies in the upper panel. We can recover bubble edges very well when EWLyα, limit is at least the median emergent EW of galaxies (≈30 Å). When EWLyα, limit is too shallow (≫30 Å), we cannot get useful information about Lyα transmission from our observations, thus the recovered bubbles only trace the regions around galaxies with EW greater than the detection limit.
Current usage metrics show cumulative count of Article Views (full-text article views including HTML views, PDF and ePub downloads, according to the available data) and Abstracts Views on Vision4Press platform.
Data correspond to usage on the plateform after 2015. The current usage metrics is available 48-96 hours after online publication and is updated daily on week days.
Initial download of the metrics may take a while.