Fig. A.1.
Download original image
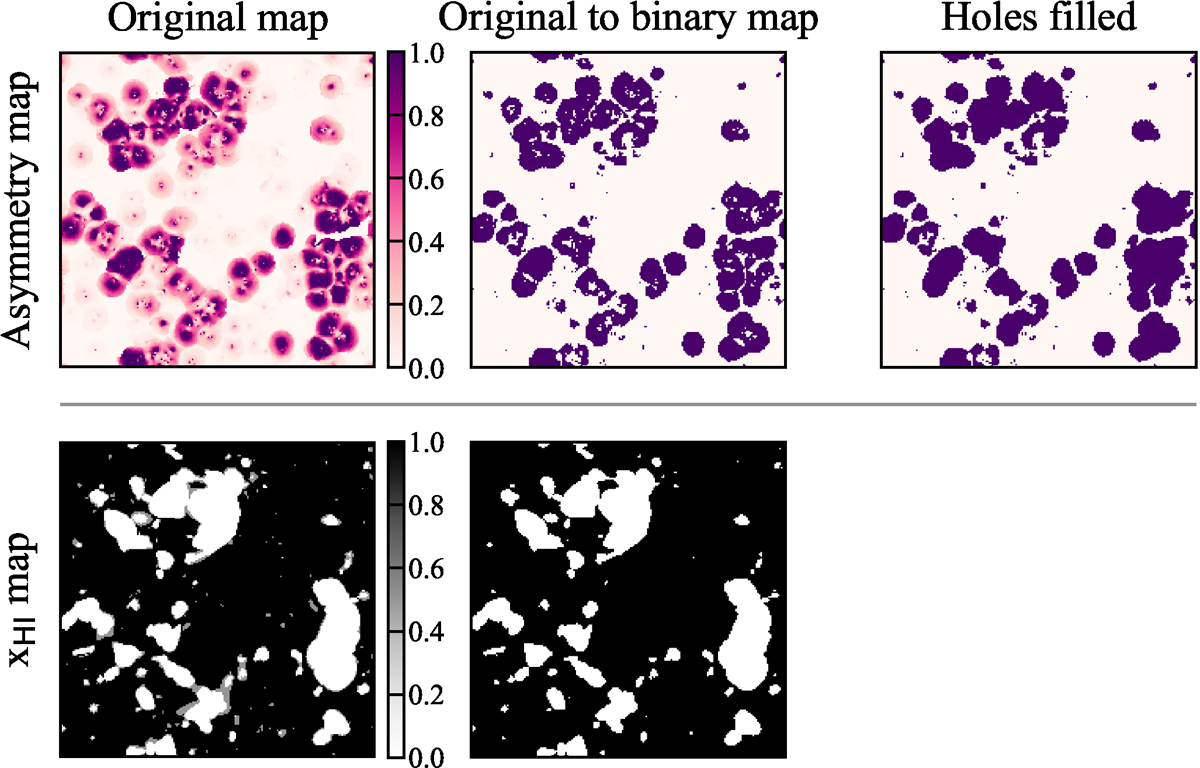
Example of converting an asymmetry score map into a binary ionization map (top panel), and converting an ionization map into a binary ionization map (bottom panel). The left column shows the original maps. The second column shows the maps converted into binary maps by setting all the pixels with asymmetry score (![]() ) above (below) a threshold ionized. The third column shows the binary map after we use scipy.ndimage.binary_fill_holes, to fill the holes, which correspond to areas inside bubbles, in the second column.
) above (below) a threshold ionized. The third column shows the binary map after we use scipy.ndimage.binary_fill_holes, to fill the holes, which correspond to areas inside bubbles, in the second column.
Current usage metrics show cumulative count of Article Views (full-text article views including HTML views, PDF and ePub downloads, according to the available data) and Abstracts Views on Vision4Press platform.
Data correspond to usage on the plateform after 2015. The current usage metrics is available 48-96 hours after online publication and is updated daily on week days.
Initial download of the metrics may take a while.