Fig. 1.
Download original image
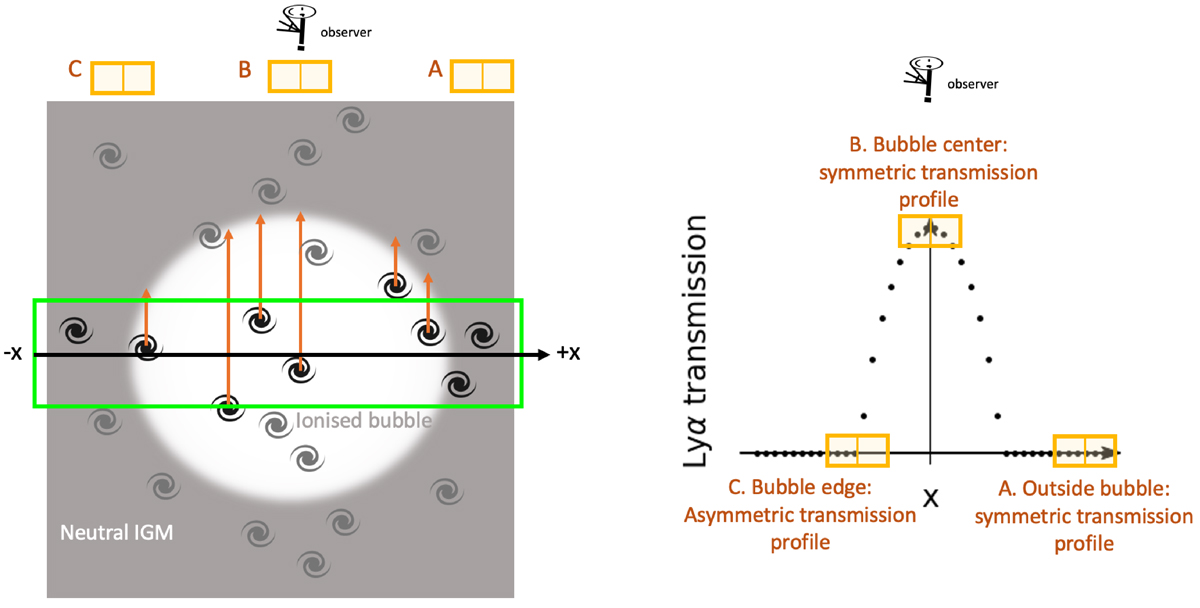
Cartoon illustrating the Lyα transmission profile of galaxies in a plane of the sky around an ionized bubble. Left: Galaxies in and around a spherical bubble with the observer at the top. Right: The integrated Lyα transmissions, 𝒯 as a function of transverse distance (x) measured using galaxies in the green box in the left panel. Transmission profiles 𝒯(x) viewed in different windows (A, B, and C) are different. Window A: Galaxies are all outside the bubble and all have 𝒯 ≈ 0 , resulting in a flat transmission profile in the window. Window B: Galaxies are located around the center of the bubble, therefore 𝒯 in the window are all high and the transmission profile is symmetric around the window center. Window C: Half of the galaxies are outside the bubble and have 𝒯 ≈ 0 . The other half of the galaxies are inside the bubble, having rising transmission toward the bubble center. The transmission profile around the center of window C is therefore asymmetric. The level of asymmetry can therefore be a probe of bubble edges.
Current usage metrics show cumulative count of Article Views (full-text article views including HTML views, PDF and ePub downloads, according to the available data) and Abstracts Views on Vision4Press platform.
Data correspond to usage on the plateform after 2015. The current usage metrics is available 48-96 hours after online publication and is updated daily on week days.
Initial download of the metrics may take a while.