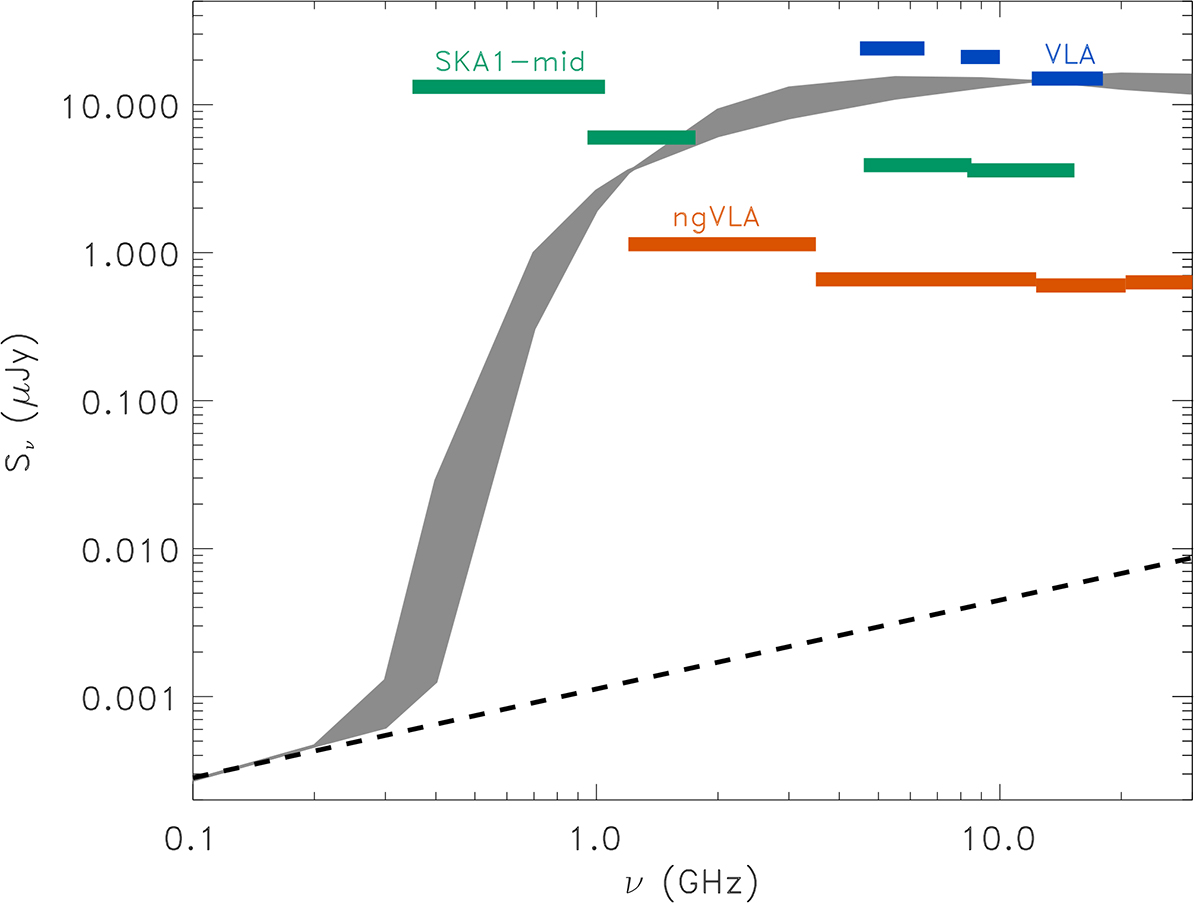
Fig. 6.
Download original image
Theoretical radio spectra of the qWR component in the HD 45166 system in comparison with the upper limits derived from the VLA observations (blue boxes). The black dashed line is for a spherical wind with mass-loss rate Ṁ = 3 × 10⁻¹⁰ M⊙ yr−1 and V∞ = 1200 km s−1. The grey shaded area shows the variety of non-thermal gyro-synchrotron spectra computed for different orientations of the magnetosphere with respect to the observer, assuming two distinct values of the spectral index δ, and accounting for the attenuation in the stellar wind. The green boxes represent the expected 3σ threshold of the noise levels that will be reached with observations 1 hour long at the observing bands that will be provided by the forthcoming SKA1-mid. The orange boxes instead represent the expected 3σ threshold of the noise levels that will be achieved assuming the same integration time (1 hour) using the observing bands that will be provided by the future ngVLA.
Current usage metrics show cumulative count of Article Views (full-text article views including HTML views, PDF and ePub downloads, according to the available data) and Abstracts Views on Vision4Press platform.
Data correspond to usage on the plateform after 2015. The current usage metrics is available 48-96 hours after online publication and is updated daily on week days.
Initial download of the metrics may take a while.