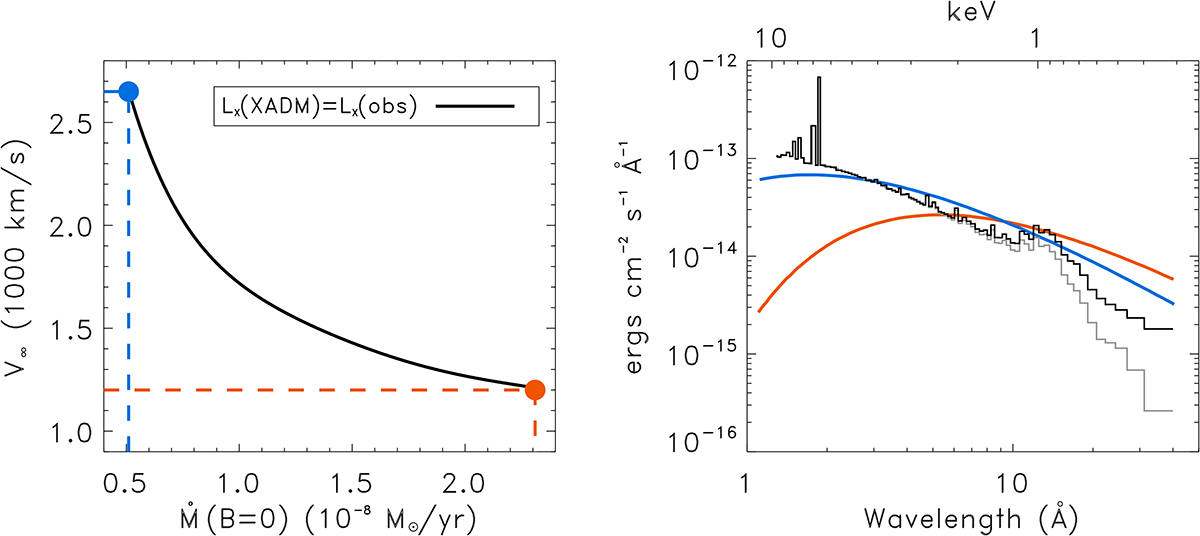
Fig. 4.
Download original image
Left: Diagram of the wind parameters of a non-magnetized star; terminal velocity vs. mass-loss rate (the two wind parameters are the free parameters of the XADM model). The black curve represents the loci of the Ṁ(B = 0) and V∞ combination where the XADM model predicts X-ray luminosity coinciding with that empirically determined for the qWR star (Table 3). The horizontal dashed red and blue lines mark, respectively, the lower and upper limits of the range of terminal wind speed values analyzed, with Ṁ(B = 0) tuned to match the observed X-ray luminosity along the black contour (log(LX/Lbol) = −5.6). Right: Associated model X-ray spectra for the fast (solid blue line) and the slower wind model (solid red line). For comparison, the X-ray spectrum of HD 45166 provided by the 3T model without the ISM absorption effect is also displayed (solid black line), the gray solid line is the X-ray spectrum with absorption shown in the left panel of Fig. 2.
Current usage metrics show cumulative count of Article Views (full-text article views including HTML views, PDF and ePub downloads, according to the available data) and Abstracts Views on Vision4Press platform.
Data correspond to usage on the plateform after 2015. The current usage metrics is available 48-96 hours after online publication and is updated daily on week days.
Initial download of the metrics may take a while.