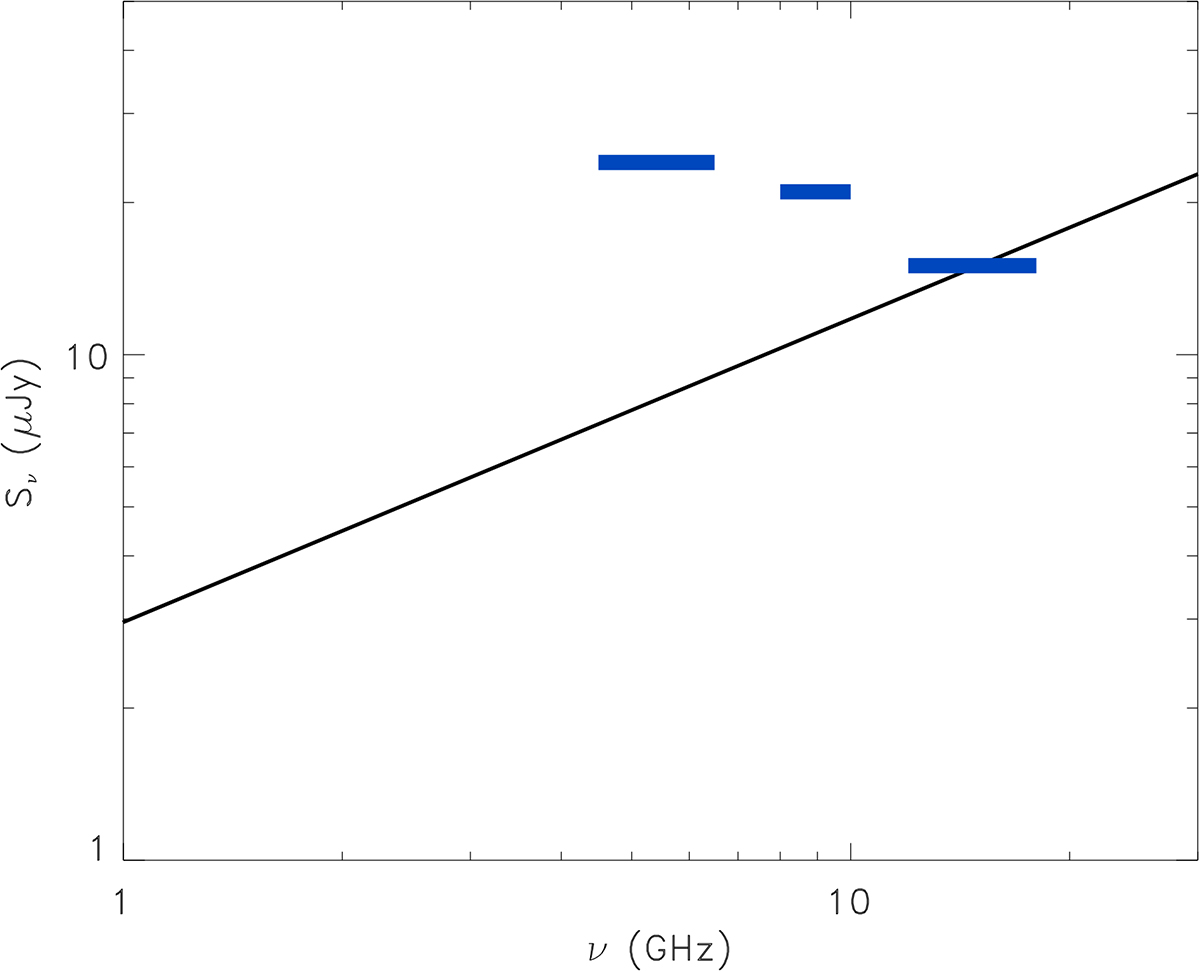
Fig. 3.
Download original image
Theoretical wind spectrum constrained by the detection thresholds. The blue boxes correspond to the 3σ noise levels measured at the sky position of HD 45166 in radio maps obtained at the three observed bands, which provide the detection threshold. The lengths of the blue boxes show the bandpass for the receivers (see Table 2). The solid black line displays the theoretical thermal wind's spectrum that corresponds to the maximum emission level that is compatible with non-detection below the 3σ threshold (Ṁmax = 1.1 × 10⁻⁷ M⊙ yr−1).
Current usage metrics show cumulative count of Article Views (full-text article views including HTML views, PDF and ePub downloads, according to the available data) and Abstracts Views on Vision4Press platform.
Data correspond to usage on the plateform after 2015. The current usage metrics is available 48-96 hours after online publication and is updated daily on week days.
Initial download of the metrics may take a while.