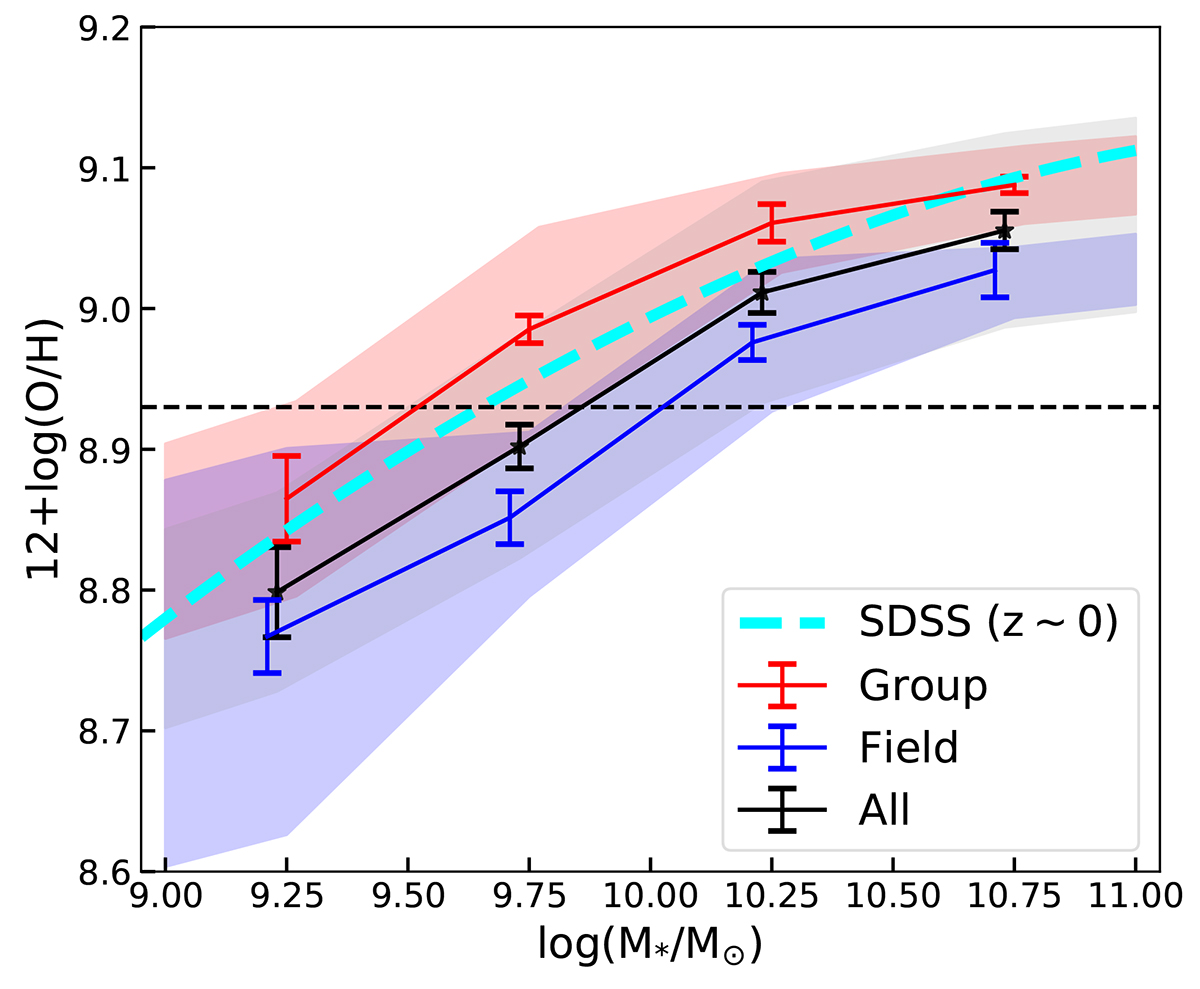
Fig. 8.
Download original image
Gas-phase metallicities as a function of galaxy stellar mass and environment as obtained from the stacked spectra. The results from all the galaxies in our sample are shown in black, while the results from the galaxies in groups are shown in red and the field galaxies in blue. The error bar indicates the measured error obtained by mock repeat measurements, while the shaded region indicates the 1σ scatter of each sample estimated from bootstrapping. The cyan dashed line indicates the MZR of local z ∼ 0 SDSS galaxies obtained by Tremonti et al. (2004), while the horizontal dashed line marks the solar oxygen abundance.
Current usage metrics show cumulative count of Article Views (full-text article views including HTML views, PDF and ePub downloads, according to the available data) and Abstracts Views on Vision4Press platform.
Data correspond to usage on the plateform after 2015. The current usage metrics is available 48-96 hours after online publication and is updated daily on week days.
Initial download of the metrics may take a while.