Fig. 7.
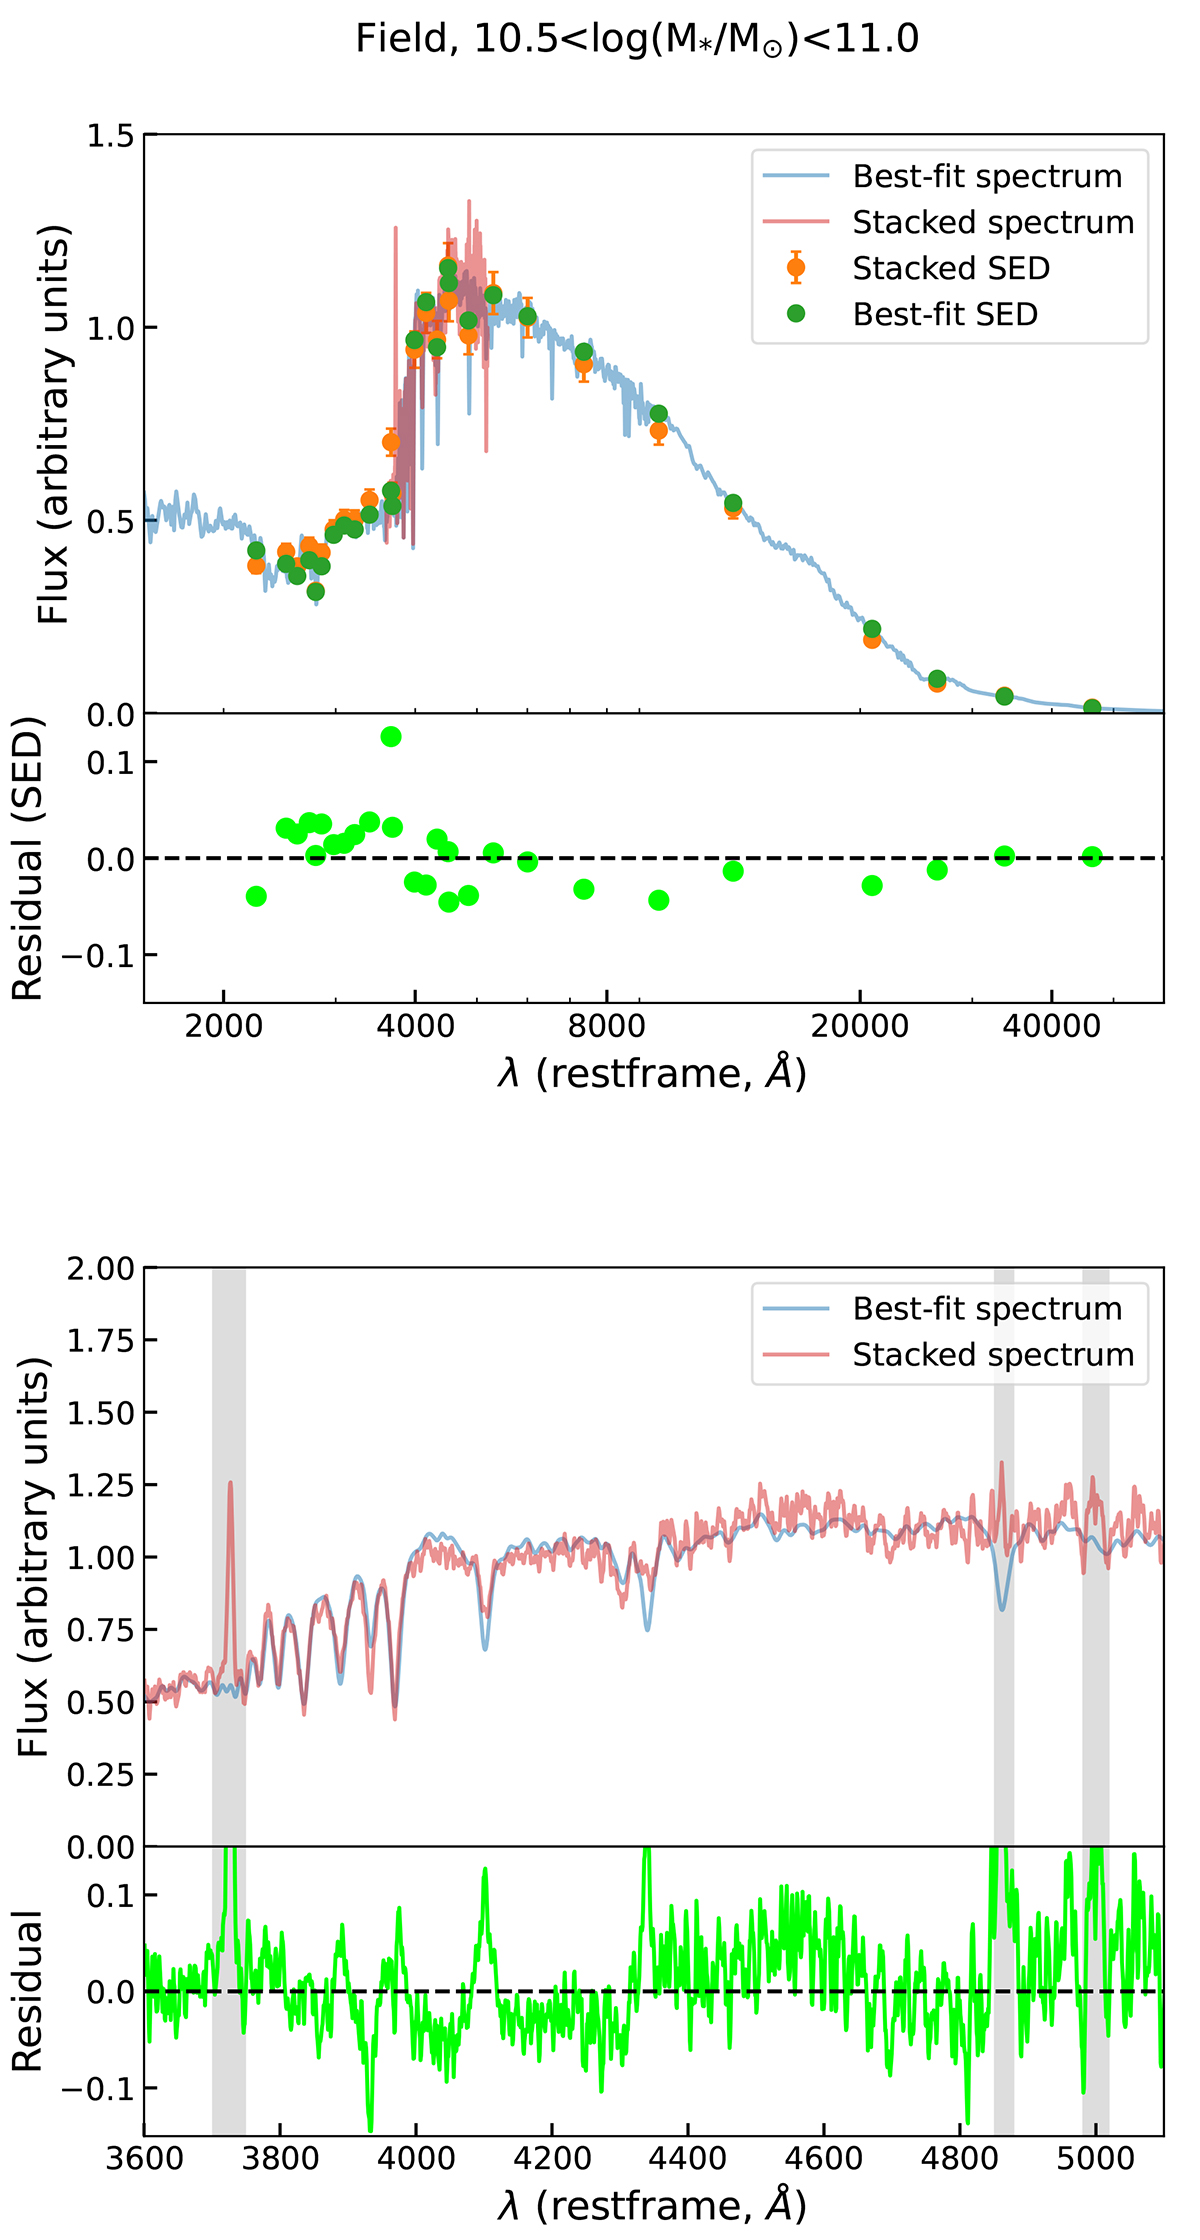
Download original image
Example of this work’s stellar population fitting process. The top panel shows our best-fit model spectrum (blue) and SED (green) compared to the stacked spectrum (pink) and SED (orange), while the bottom panel zooms into the optical range. Residuals are shown for the SED in the top panel and for the spectrum in the bottom panel. The spectral regions around the emission lines are masked during the fitting, as indicated by the shaded regions in the bottom panel.
Current usage metrics show cumulative count of Article Views (full-text article views including HTML views, PDF and ePub downloads, according to the available data) and Abstracts Views on Vision4Press platform.
Data correspond to usage on the plateform after 2015. The current usage metrics is available 48-96 hours after online publication and is updated daily on week days.
Initial download of the metrics may take a while.