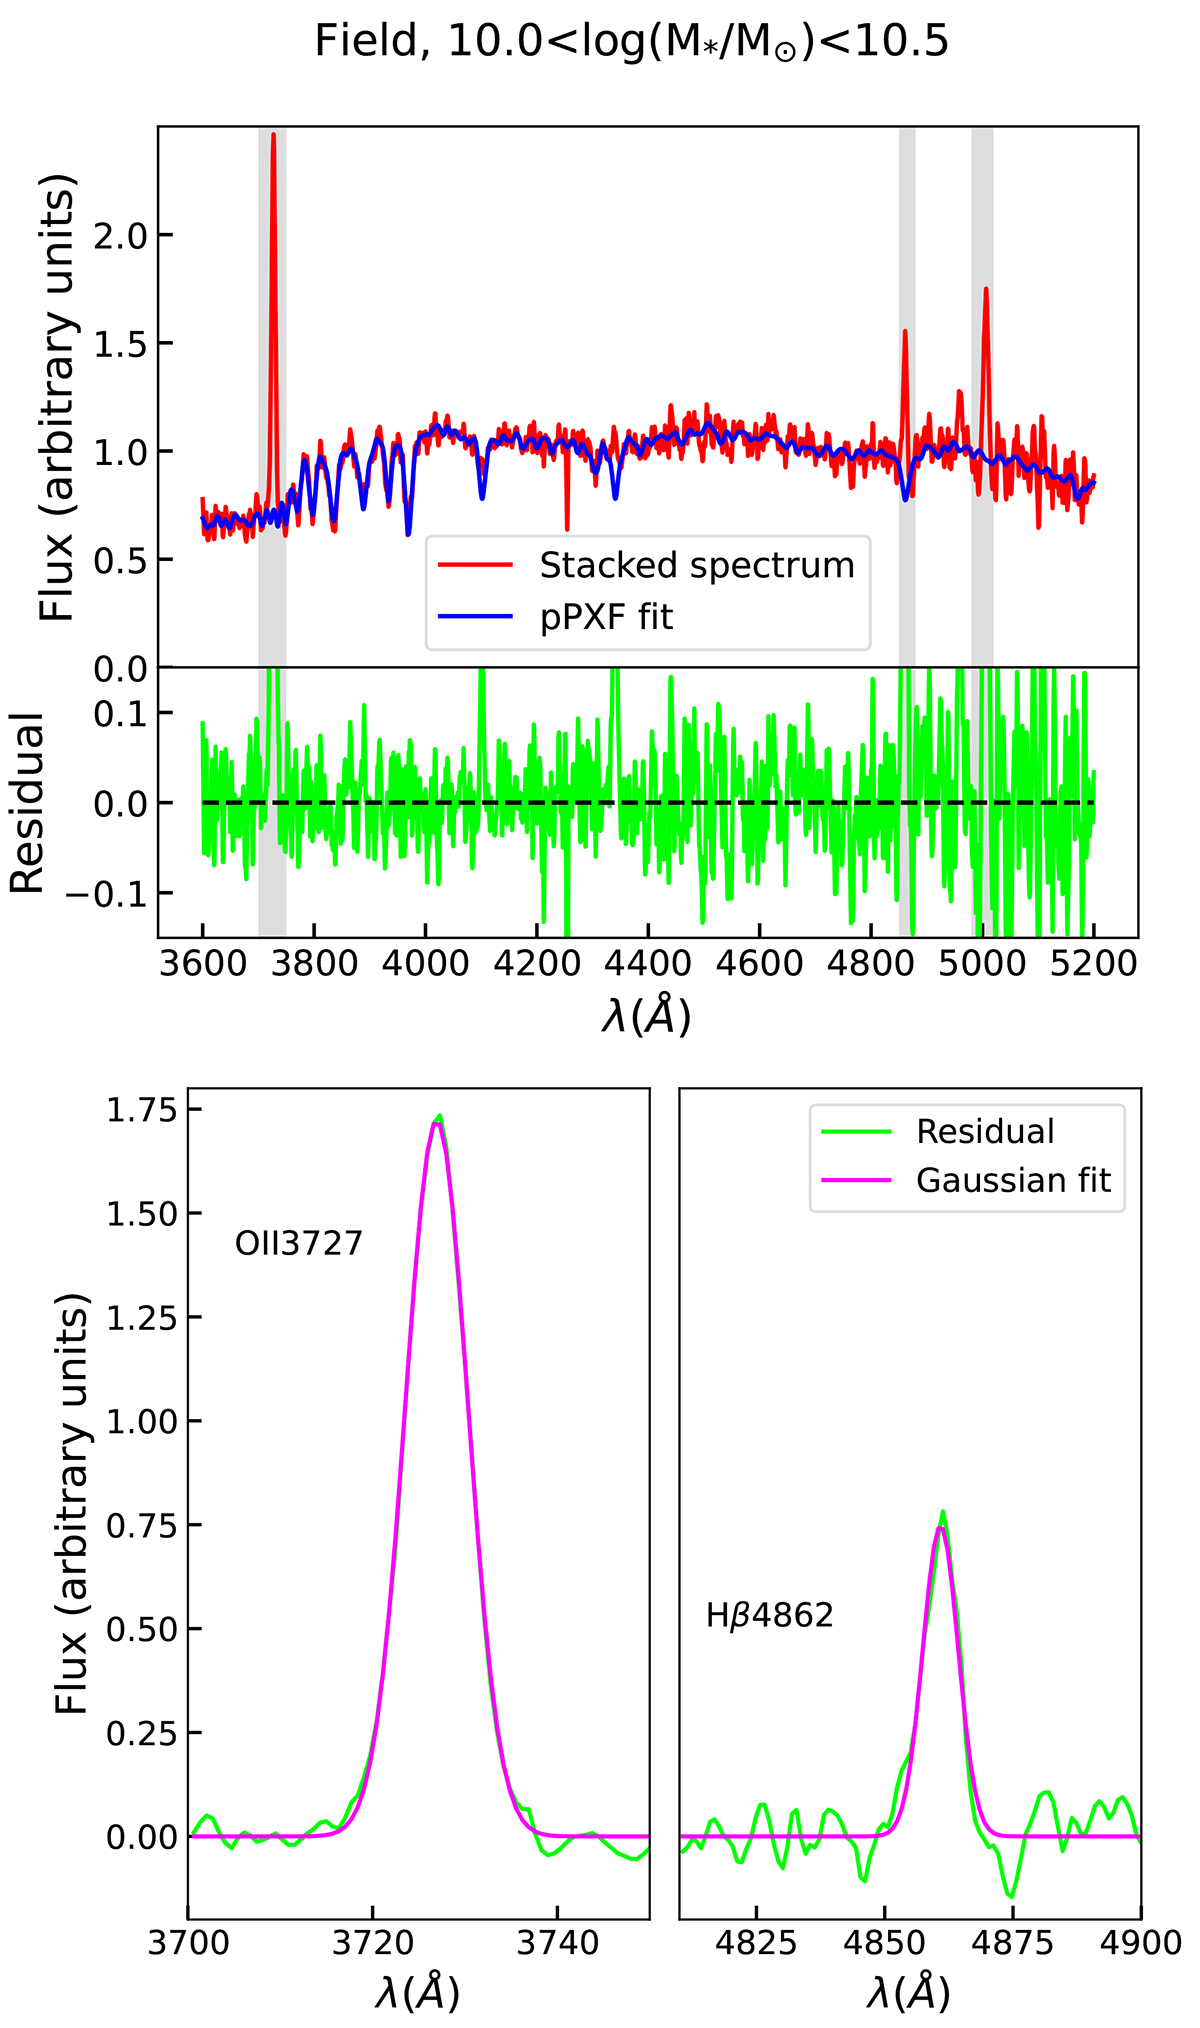
Fig. 6.
Download original image
Example of this work’s emission line measurement process. The top panel shows the pPXF fit (blue) to the continuum shape of the stacked spectrum (red), with residuals shown in lime green. In the bottom panel, we zoom in to the regions with rest-frame wavelengths around the [O II]λ3727 (left) and Hβ (right) emission lines. In the panel the residual spectrum is shown in lime green; the magenta lines show our Gaussian fit to the emission lines, as indicated.
Current usage metrics show cumulative count of Article Views (full-text article views including HTML views, PDF and ePub downloads, according to the available data) and Abstracts Views on Vision4Press platform.
Data correspond to usage on the plateform after 2015. The current usage metrics is available 48-96 hours after online publication and is updated daily on week days.
Initial download of the metrics may take a while.