Open Access
Fig. 5.
Download original image
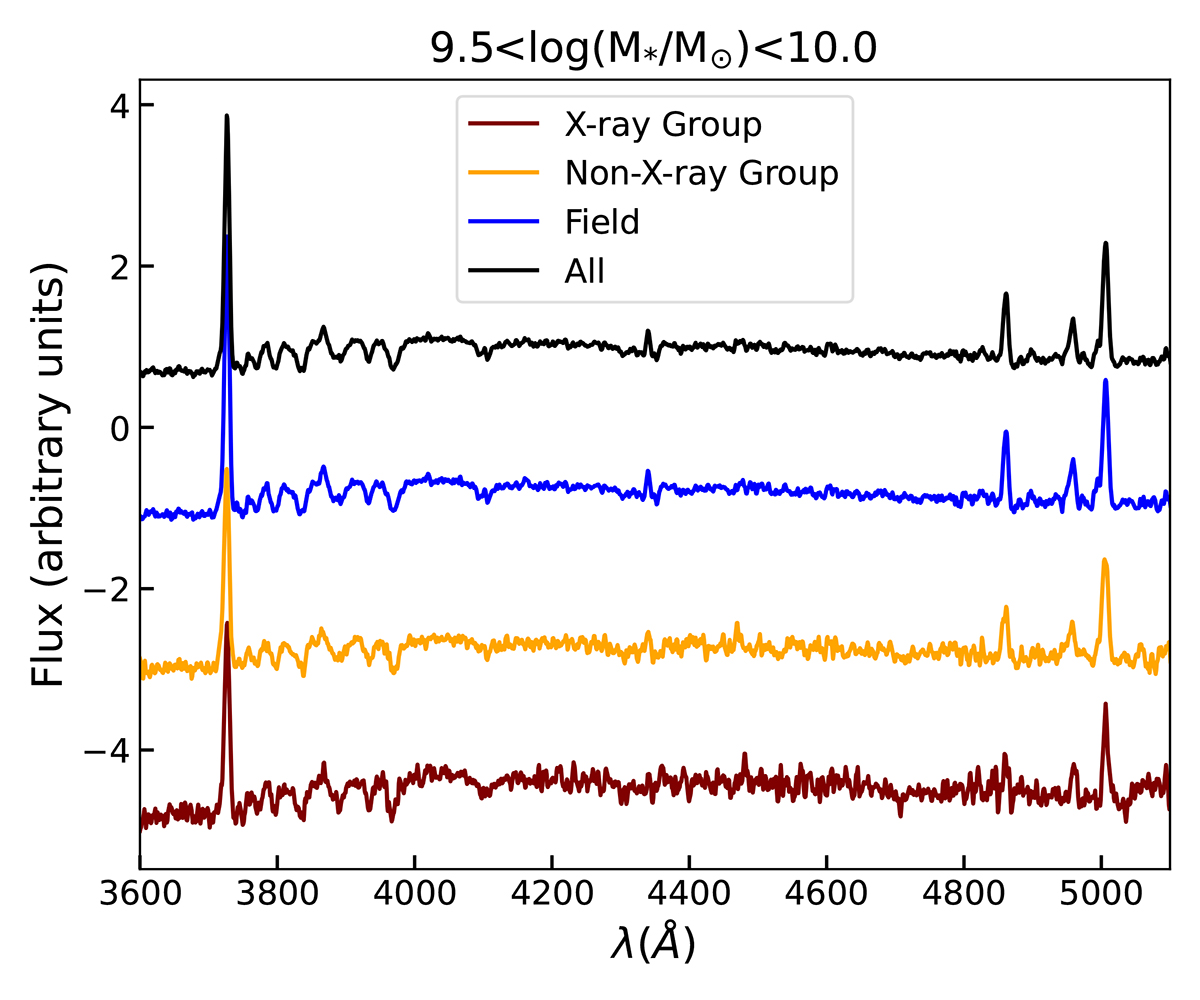
Examples of stacked spectra in the stellar mass bin 109.5 < M*/M⊙ < 1010.0. The stacking of all galaxies and of galaxies in different environments are shown with different colours, as indicated in the inset. Spectra are shifted vertically to avoid overlapping.
Current usage metrics show cumulative count of Article Views (full-text article views including HTML views, PDF and ePub downloads, according to the available data) and Abstracts Views on Vision4Press platform.
Data correspond to usage on the plateform after 2015. The current usage metrics is available 48-96 hours after online publication and is updated daily on week days.
Initial download of the metrics may take a while.