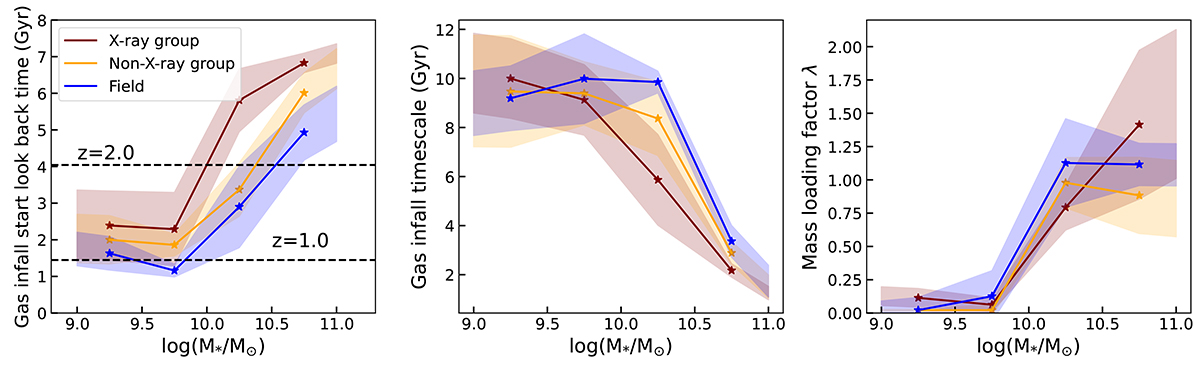
Fig. 12.
Download original image
Start time of the gas infall (left), gas infall timescale (middle), and outflow strength as indicated by the wind parameter factor (right) of our sample galaxies as functions of their stellar mass, obtained from best-fit models of the stacked spectra and SEDs. The results from galaxies in X-ray groups are shown with dark red lines, while galaxies in non-X-ray groups are shown in orange and field galaxies in blue. The shaded regions are 1σ scatters estimated from bootstrapping.
Current usage metrics show cumulative count of Article Views (full-text article views including HTML views, PDF and ePub downloads, according to the available data) and Abstracts Views on Vision4Press platform.
Data correspond to usage on the plateform after 2015. The current usage metrics is available 48-96 hours after online publication and is updated daily on week days.
Initial download of the metrics may take a while.