Fig. 11.
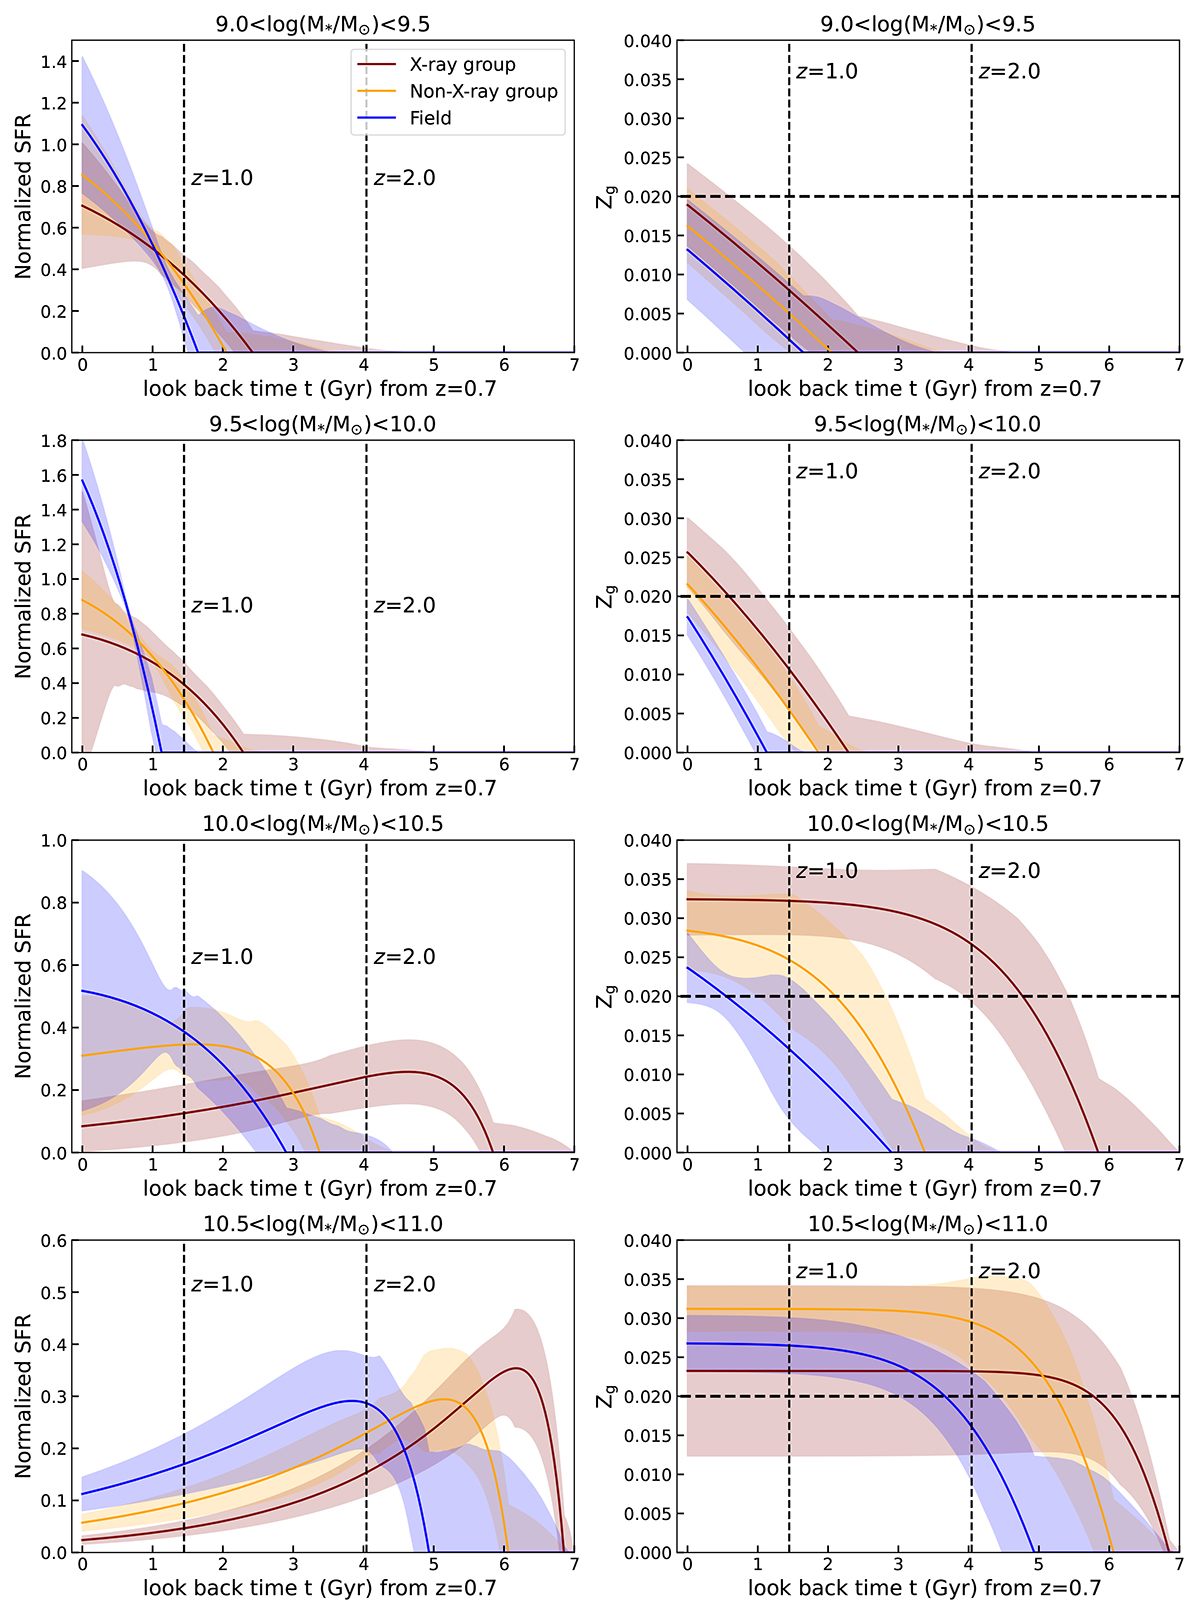
Download original image
SFHs (left) and ChEHs (right) of our sample galaxies, as obtained from best-fit models of the stacked spectra and SEDs. From top to bottom, the different rows show the results from the different stellar mass bins, as indicated. Results from galaxies in X-ray groups are shown with dark red lines, while galaxies in non-X-ray groups are shown in orange and field galaxies in blue. Shaded regions are 1σ scatters estimated from the bootstrapping process. The two vertical dashed lines indicate the position of redshift z = 1.0 and z = 2.0, respectively. The horizontal dashed line marks the solar metallicity used in this work.
Current usage metrics show cumulative count of Article Views (full-text article views including HTML views, PDF and ePub downloads, according to the available data) and Abstracts Views on Vision4Press platform.
Data correspond to usage on the plateform after 2015. The current usage metrics is available 48-96 hours after online publication and is updated daily on week days.
Initial download of the metrics may take a while.