Fig. 10.
Download original image
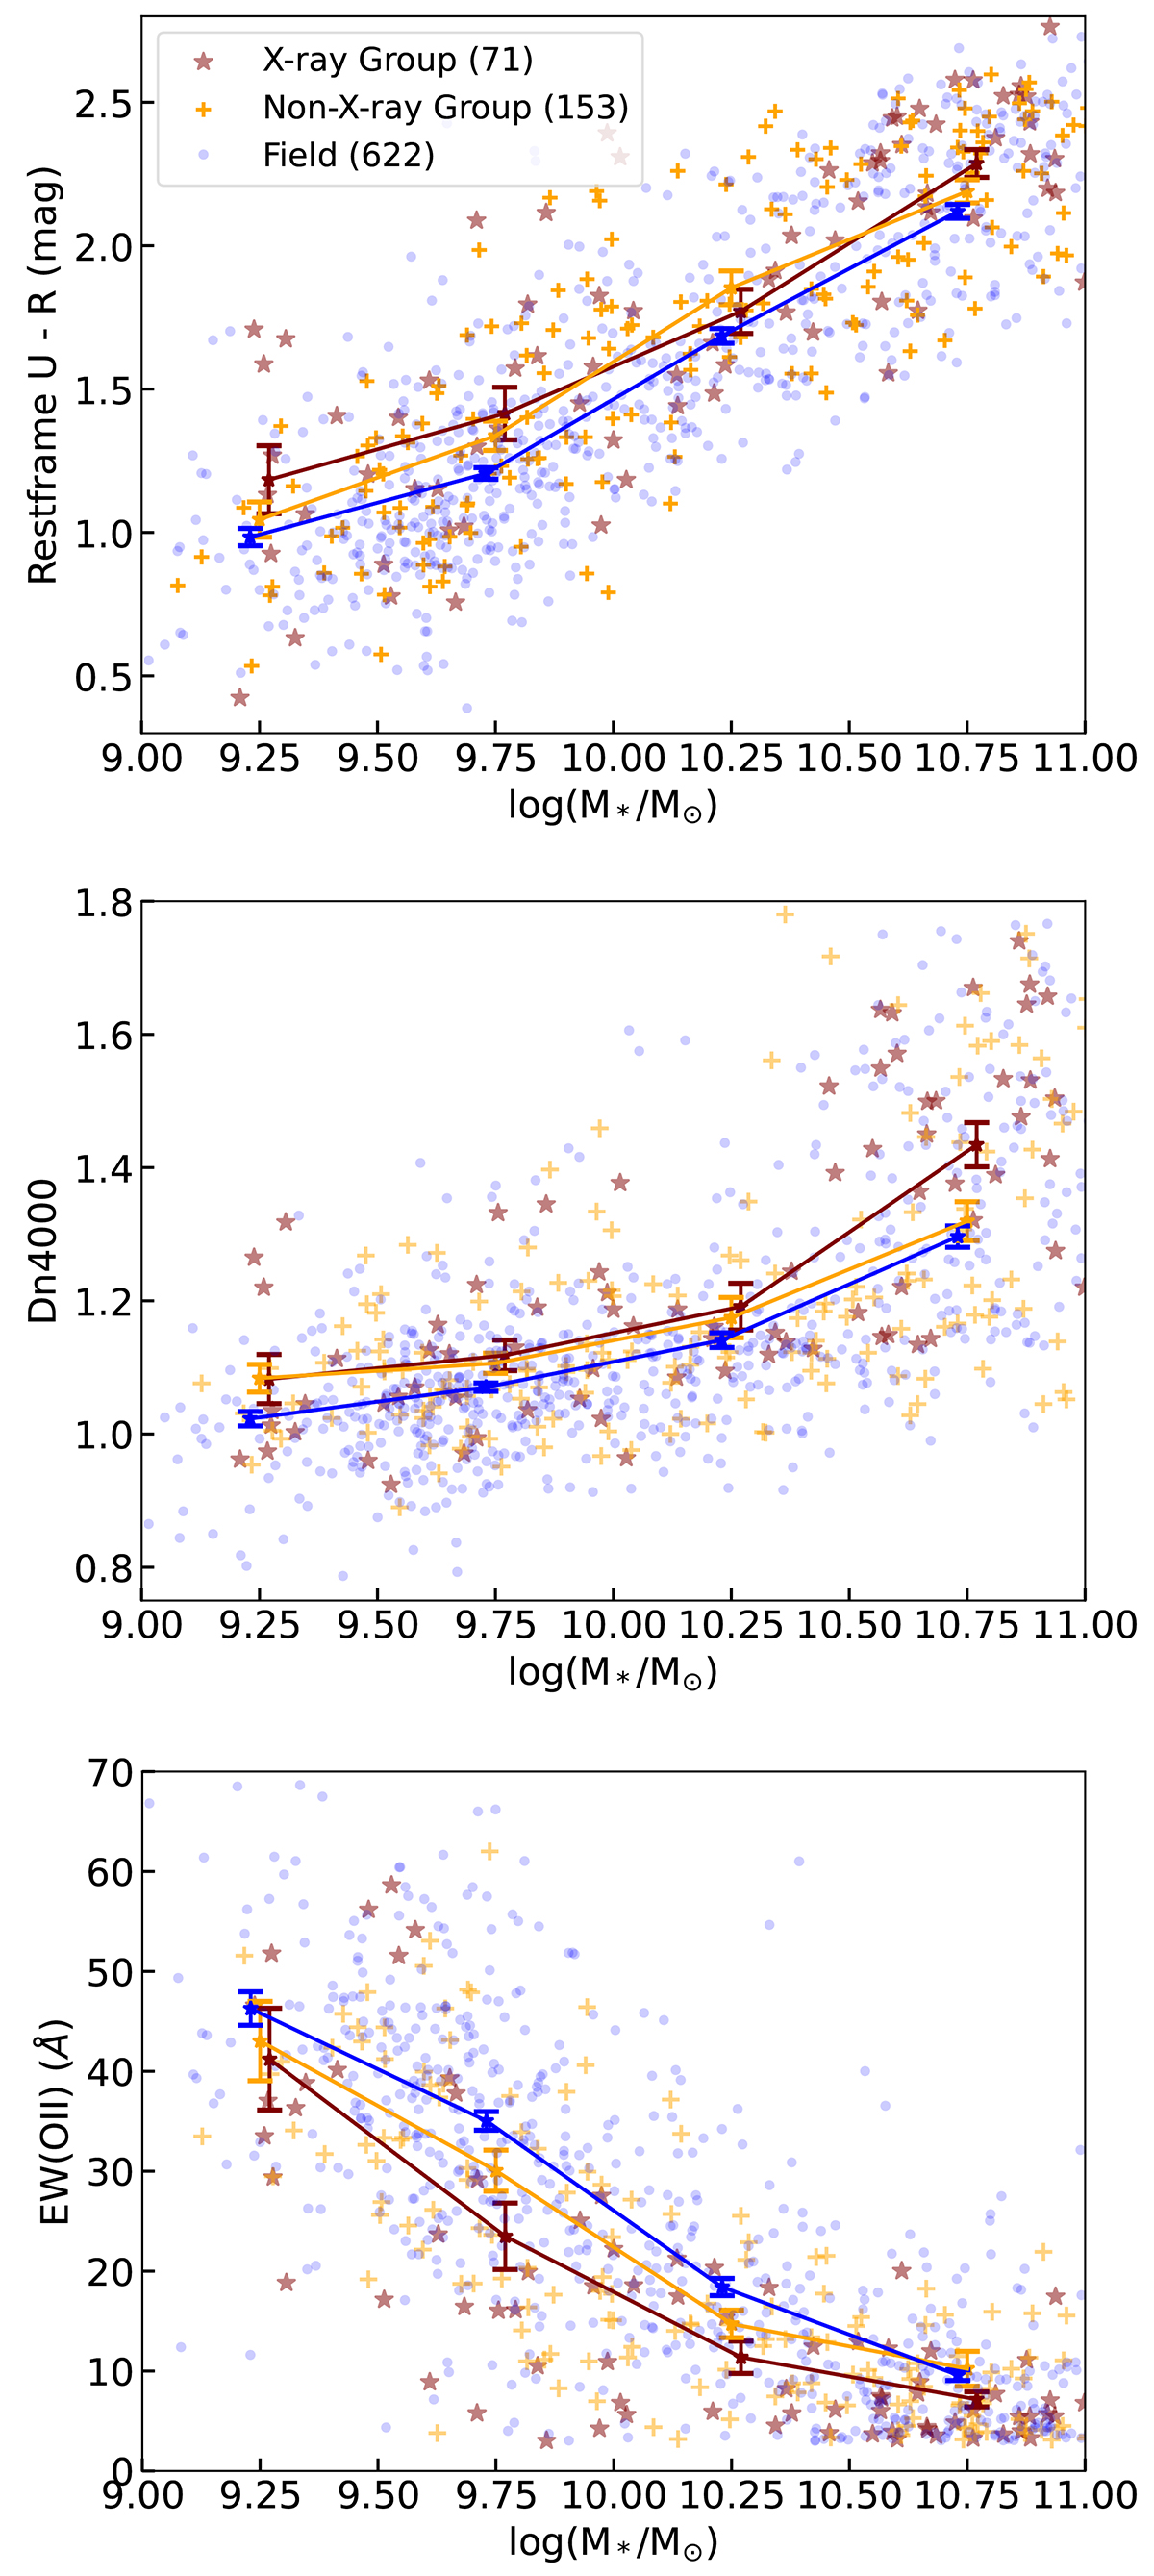
Rest-frame U − R colour (top), Dn4000 index (middle), and [O II] equivalent width (bottom) of our sample galaxies as a function of stellar mass. Galaxies in X-ray groups are shown with dark red stars, while galaxies in non-X-ray groups are shown with orange crosses and field galaxies with blue dots. The legend in the top panel indicates the total number of galaxies for each category. The coloured lines show the mean values in the stellar mass bins of the corresponding category of galaxies, with error bars indicating the 1σ error of the mean value.
Current usage metrics show cumulative count of Article Views (full-text article views including HTML views, PDF and ePub downloads, according to the available data) and Abstracts Views on Vision4Press platform.
Data correspond to usage on the plateform after 2015. The current usage metrics is available 48-96 hours after online publication and is updated daily on week days.
Initial download of the metrics may take a while.