Fig. 1.
Download original image
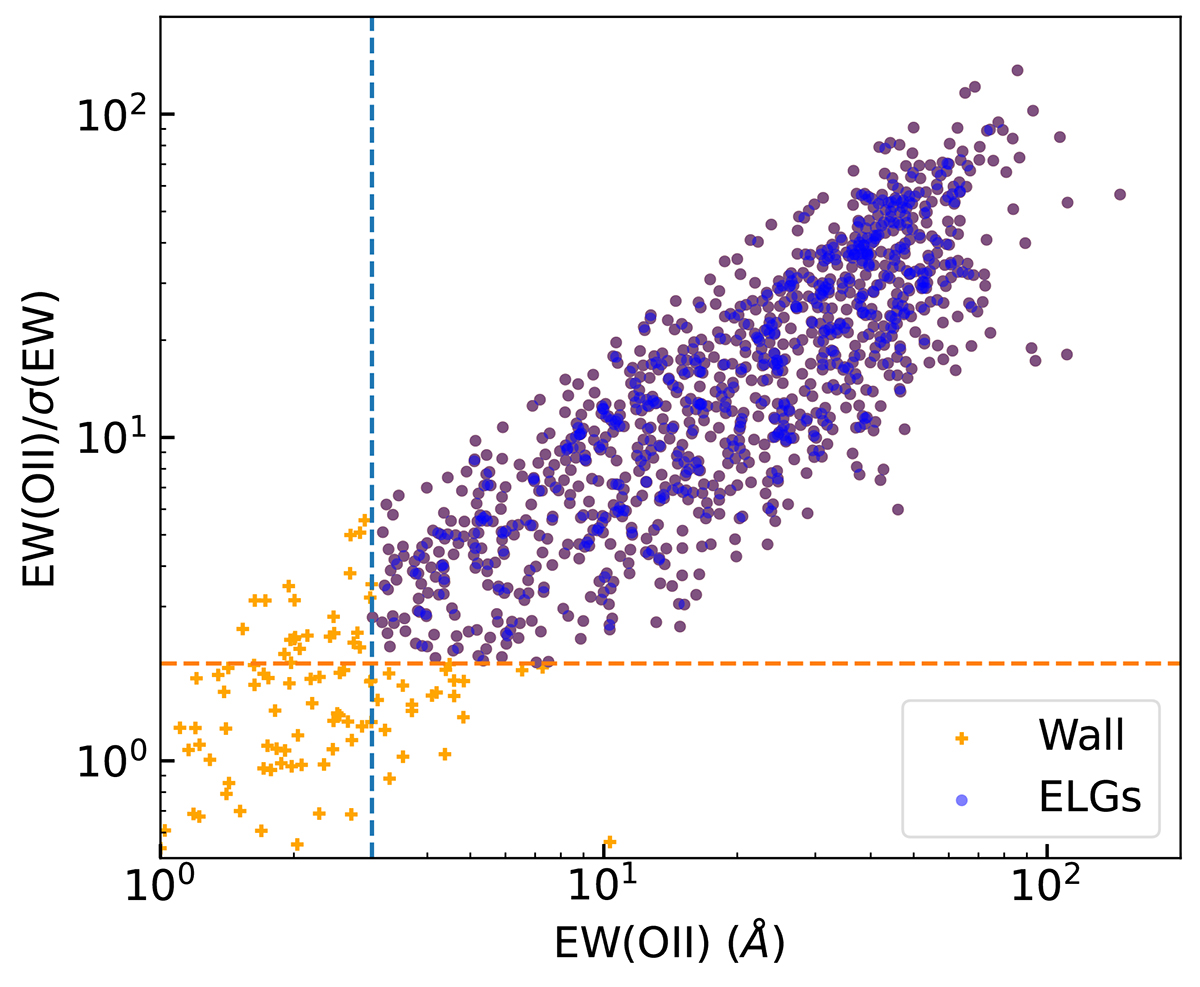
Detection significance of the [O II] line equivalent width, EW(OII)/σEW, as a function of EW(OII). The orange crosses show all the Wall galaxies, while the blue dots are those identified as ELGs. The horizontal dashed line marks the limit for a 2σ detection, while the vertical dashed line marks the position of EW(OII) = 3 Å.
Current usage metrics show cumulative count of Article Views (full-text article views including HTML views, PDF and ePub downloads, according to the available data) and Abstracts Views on Vision4Press platform.
Data correspond to usage on the plateform after 2015. The current usage metrics is available 48-96 hours after online publication and is updated daily on week days.
Initial download of the metrics may take a while.