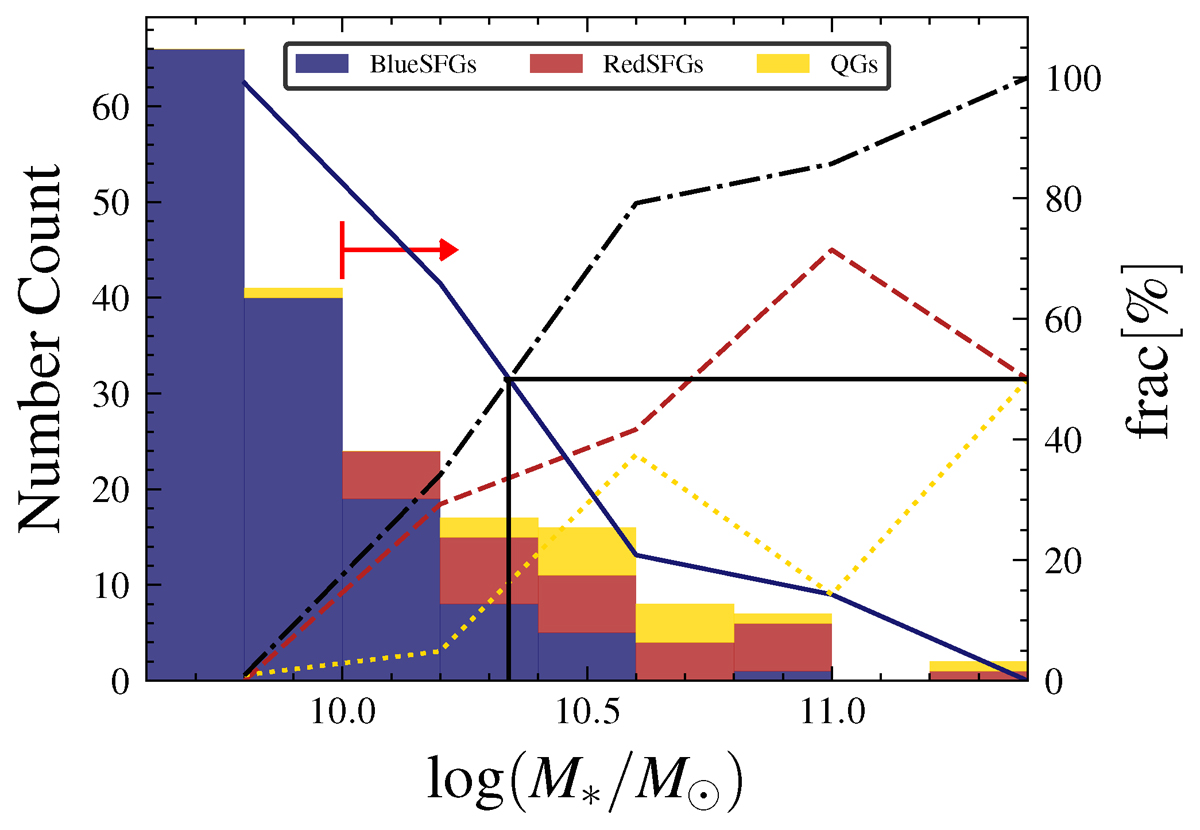
Fig. 9.
Download original image
Mass distribution and relative fractions of the 142 BlueSFGs (blue solid line), 32 RedSFGs (red dashed line), and 14 QGs (yellow dotted line) as a function of stellar mass. The cumulative contribution of RedSFGs and QGs to the total number count as a function of stellar mass is displayed as a black dash-dotted line. The black solid lines show the stellar mass above which > 50% of galaxies are either RedSFGs or QGs. The arrow indicates the mass completeness limit for the RedSFGs population.
Current usage metrics show cumulative count of Article Views (full-text article views including HTML views, PDF and ePub downloads, according to the available data) and Abstracts Views on Vision4Press platform.
Data correspond to usage on the plateform after 2015. The current usage metrics is available 48-96 hours after online publication and is updated daily on week days.
Initial download of the metrics may take a while.