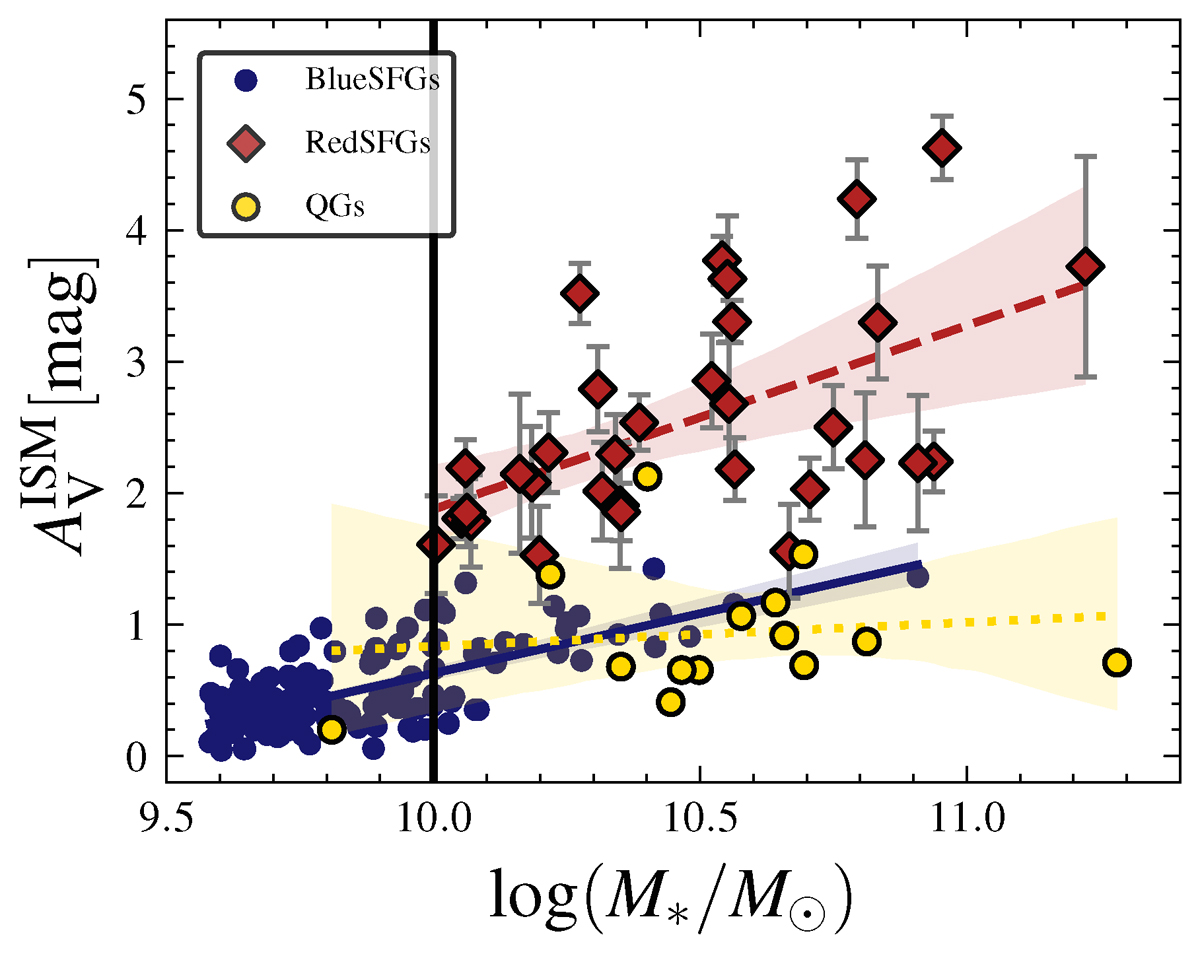
Fig. 8.
Download original image
Dust attenuation as a function of stellar mass for our final 3 < z < 4 sample. BlueSFGs, RedSFGs and QGs are represented with blue dots, red diamonds and yellow dots with black circle, respectively. Their regression lines and ∼95% uncertainties are shown with a solid, dashed and doted line with a shaded area. We indicate the 99% mass-completeness limit of the sample with a thick black line.
Current usage metrics show cumulative count of Article Views (full-text article views including HTML views, PDF and ePub downloads, according to the available data) and Abstracts Views on Vision4Press platform.
Data correspond to usage on the plateform after 2015. The current usage metrics is available 48-96 hours after online publication and is updated daily on week days.
Initial download of the metrics may take a while.