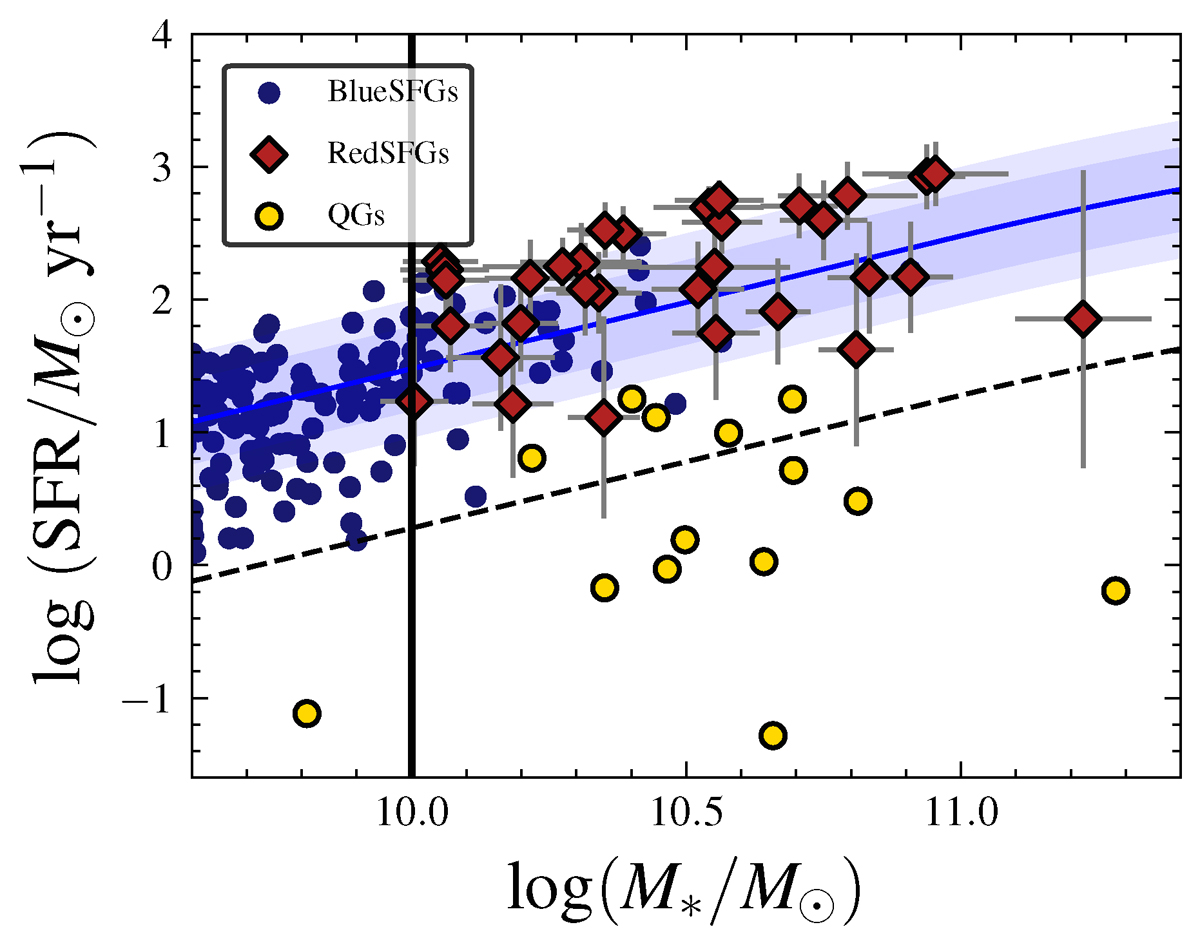
Fig. 7.
Download original image
Location of BlueSFGs, RedSFGs, and QGs at 3 < z < 4 in the SFR–M* plane. The Schreiber et al. (2015) MS is displayed as a solid blue line. We represent the 1σ scatter of this MS associated with 0.5 < ΔMS < 2 (∼0.3 dex) as a shaded blue area as well as a wider scatter of 0.33 < ΔMS < 3 (∼0.5 dex) in lighter blue. The ΔMS < 0.6 dex criterion used in combination with the UVJ diagram to define QGs. We rescaled all SFR values to the median redshift of our mass-complete sample (zmedian = 3.51) as explained in the main text. The sample is mass-complete for the three populations above the thick black line.
Current usage metrics show cumulative count of Article Views (full-text article views including HTML views, PDF and ePub downloads, according to the available data) and Abstracts Views on Vision4Press platform.
Data correspond to usage on the plateform after 2015. The current usage metrics is available 48-96 hours after online publication and is updated daily on week days.
Initial download of the metrics may take a while.