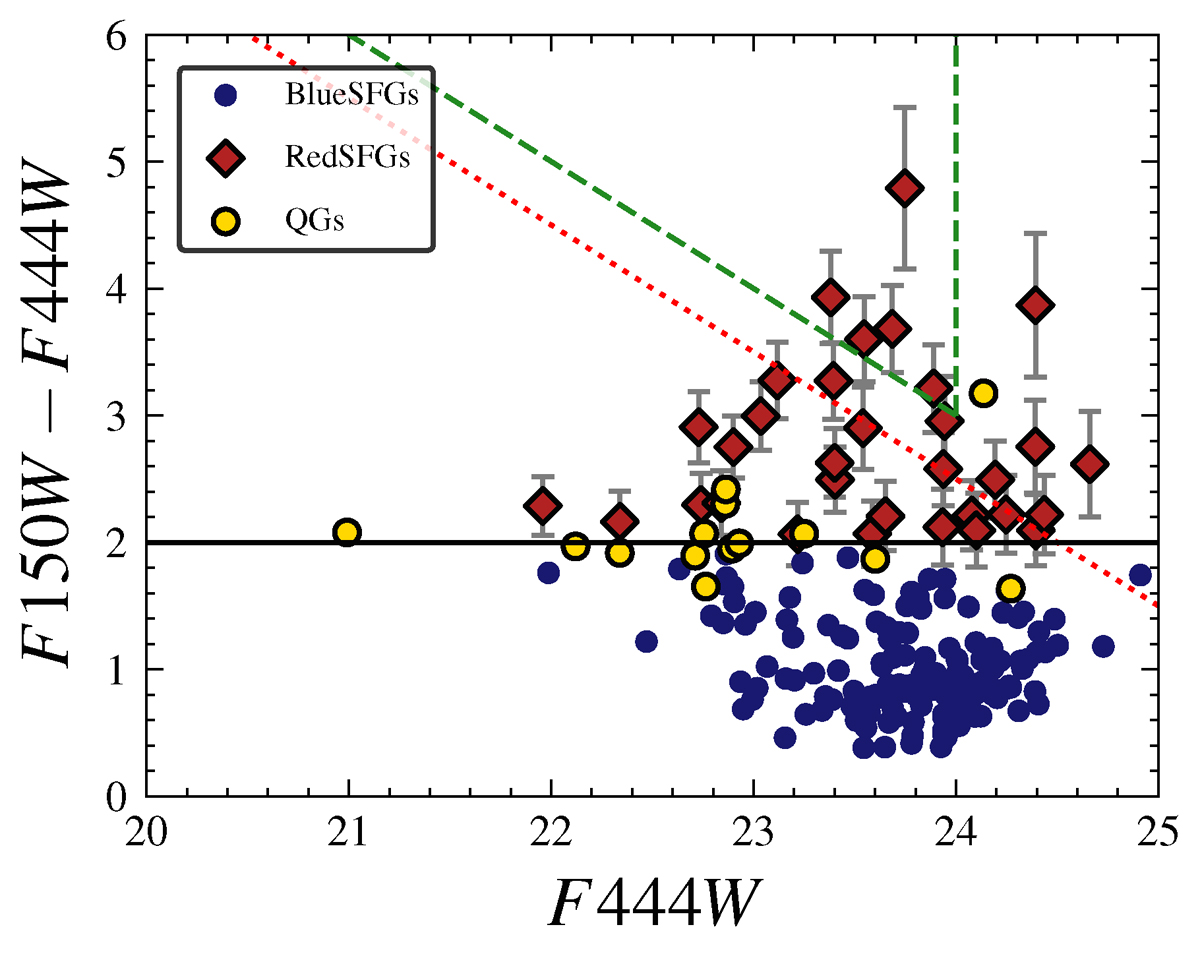
Fig. 6.
Download original image
F150W − F444W versus F444W color-magnitude distribution for our 3 < z < 4 sample. The markers show the color-selected populations of BlueSFGs, RedSFGs and QGs located above the black solid line defining our RedSFGs selection criteria. As a reference, we indicate the selection criteria for H-dropouts in Wang et al. (2019) (i.e., F150W > 27 mag and F444W < 24 mag) as a green dashed triangular region and the OFG selection from Xiao et al. (2023) (i.e., F150W > 26.5 mag and F444W < 25 mag) as a red dotted line.
Current usage metrics show cumulative count of Article Views (full-text article views including HTML views, PDF and ePub downloads, according to the available data) and Abstracts Views on Vision4Press platform.
Data correspond to usage on the plateform after 2015. The current usage metrics is available 48-96 hours after online publication and is updated daily on week days.
Initial download of the metrics may take a while.