Fig. 4.
Download original image
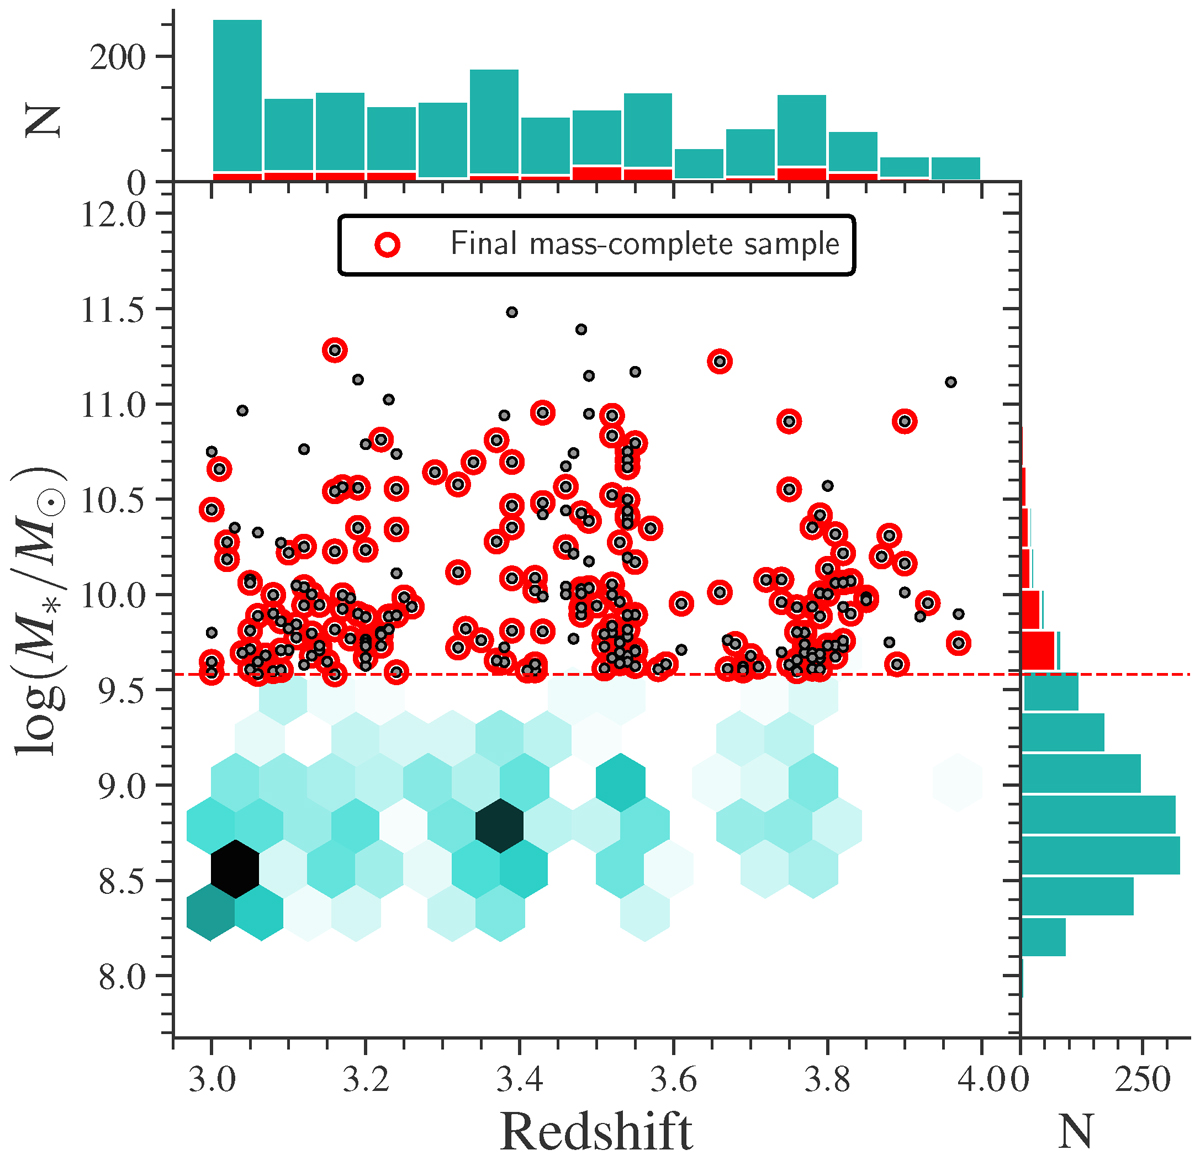
Distribution of the parent and final mass-complete samples in terms of stellar mass and redshift over the studied redshift range. The parent sample is represented as a light green-scale density map. The horizontal red dashed line indicates the limiting mass of log(M*/M⊙) > 9.6 where the parent sample is 90% complete and contains 237 galaxies. Sources encircled in red define the final mass-complete sample of 188 galaxies used in this paper. This sample is clean from objects with uncertain redshifts, potential AGN contaminants or bad SED fits. The redshift and stellar mass distributions of the two samples are shown as marginal histograms of their respective colors.
Current usage metrics show cumulative count of Article Views (full-text article views including HTML views, PDF and ePub downloads, according to the available data) and Abstracts Views on Vision4Press platform.
Data correspond to usage on the plateform after 2015. The current usage metrics is available 48-96 hours after online publication and is updated daily on week days.
Initial download of the metrics may take a while.