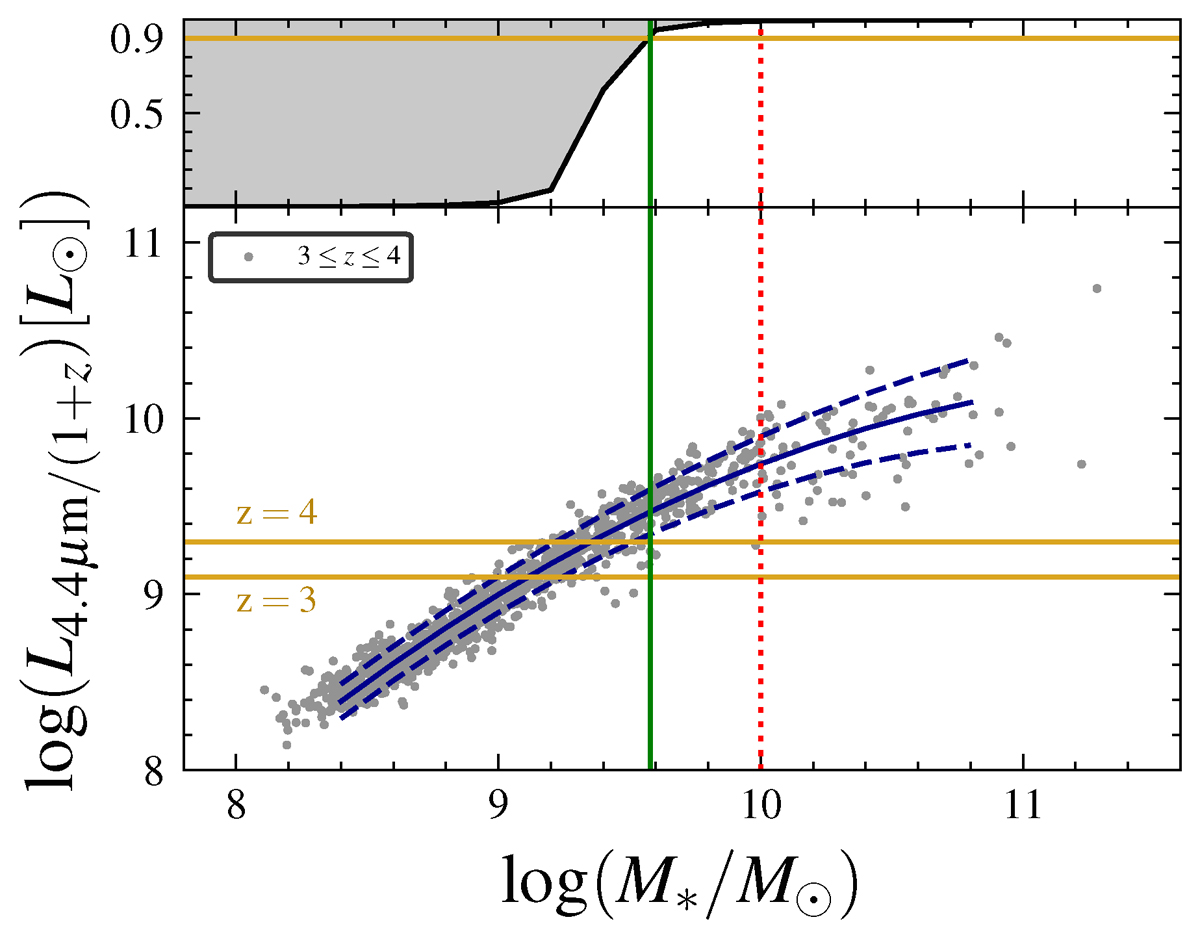
Fig. 3.
Download original image
Lower panel: Distribution in stellar mass and luminosity at rest-frame wavelength 4.4 μm/(1 + z) with 3 ≤ z ≤ 4 for the final sample of 1202 galaxies. The best-fit relation with its 1σ dispersion are displayed in solid and dashed blue lines, respectively. The position of the F444W = 25 limiting magnitudes for z = 3 and z = 4 are shown with two golden lines. Upper panel: Evolution of completeness with stellar mass at the z = 4 luminosity limit. The horizontal golden line showing the 90% completeness level. Consequently, the green vertical line defines the estimated 90% mass completeness limit. Taking into account galaxies with low mass-to-light ratios, our sample is 99% complete for this population to the right of the red dotted line.
Current usage metrics show cumulative count of Article Views (full-text article views including HTML views, PDF and ePub downloads, according to the available data) and Abstracts Views on Vision4Press platform.
Data correspond to usage on the plateform after 2015. The current usage metrics is available 48-96 hours after online publication and is updated daily on week days.
Initial download of the metrics may take a while.