Fig. 13.
Download original image
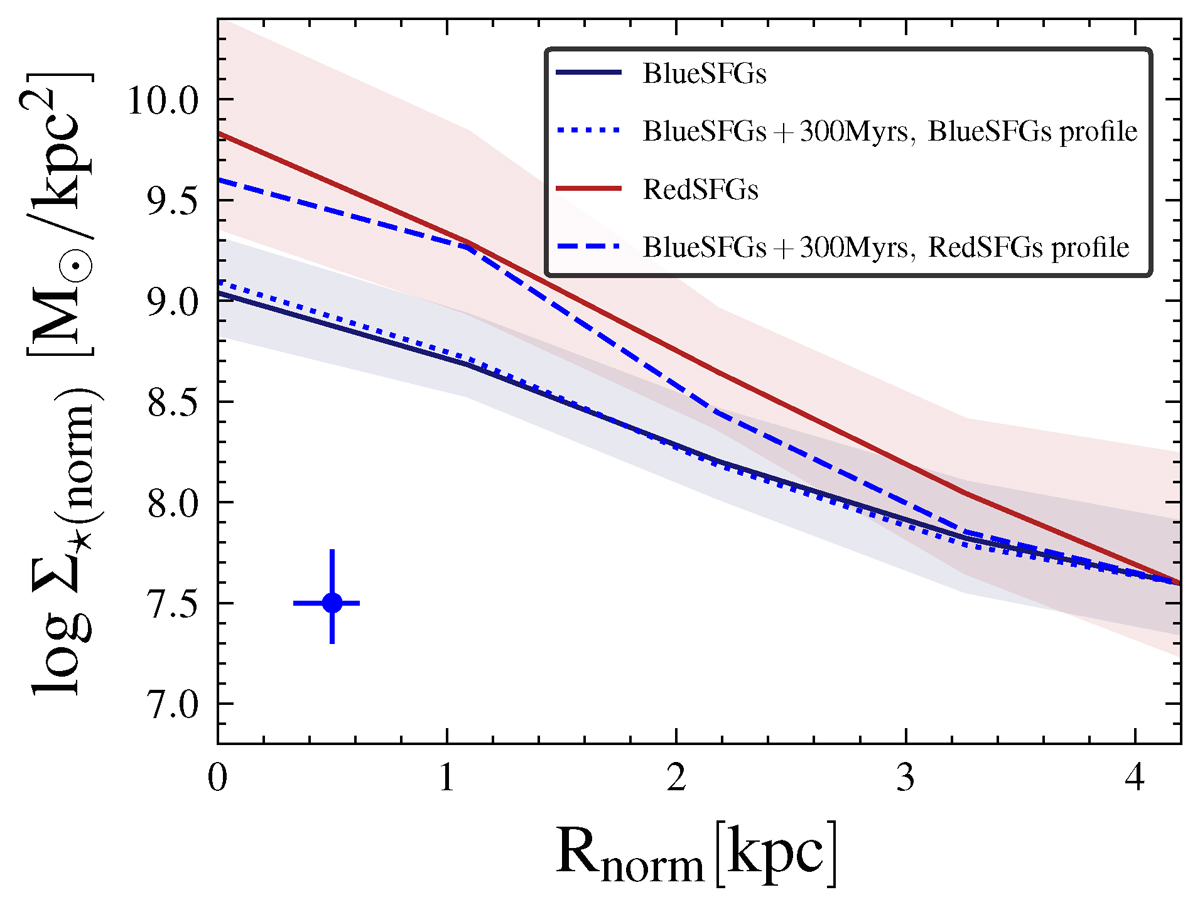
Median radial profiles of Σ⋆ for BlueSFGs (in solid blue line) and RedSFGs (in solid red line) with their associated uncertainties represented as blue and shaded regions, respectively. The blue dotted curve represent the radial evolution of Σ⋆ for BlueSFGs over the next 300 Myr, derived by applying their median radial profile of star formation surface density (ΣSFR), assumed constant during this period. Additionally, the evolution of the median Σ⋆ radial profile of BlueSFGs over the next 300 Myr considering the ΣSFR profile of RedSFGs is displayed as a dashed blue curve. Each profile is normalised to the Σ⋆ at 4 kpc of RedSFGs. We display the typical median uncertainty of the dotted and dashed profiles by a blue error bar.
Current usage metrics show cumulative count of Article Views (full-text article views including HTML views, PDF and ePub downloads, according to the available data) and Abstracts Views on Vision4Press platform.
Data correspond to usage on the plateform after 2015. The current usage metrics is available 48-96 hours after online publication and is updated daily on week days.
Initial download of the metrics may take a while.