Fig. 12.
Download original image
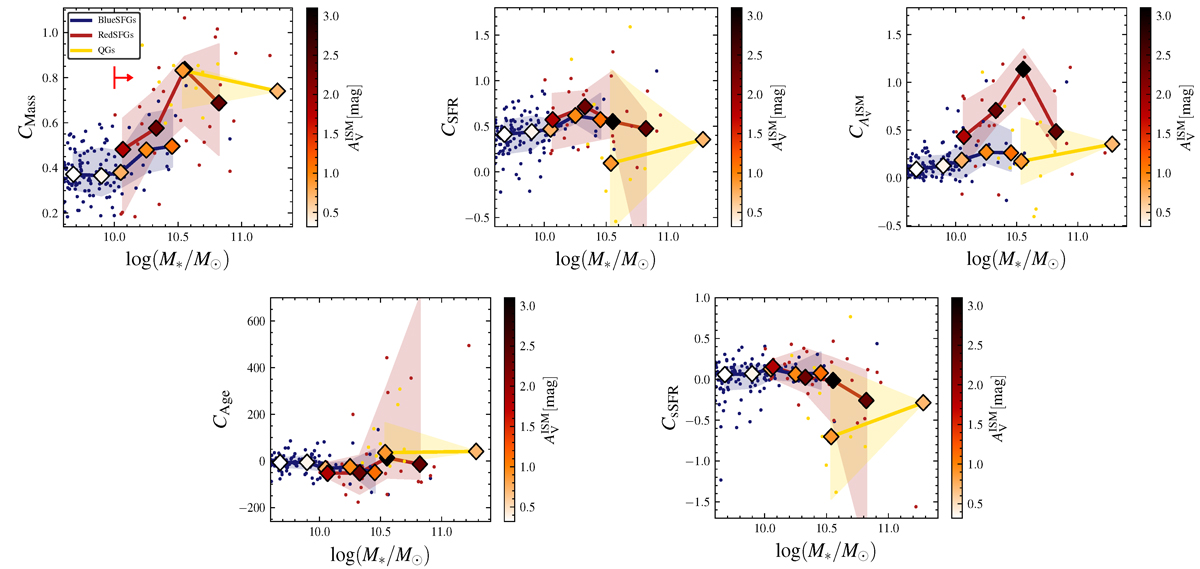
From left to right and top to bottom: Σ⋆, ΣSFR, ![]() , sSFR, and mass-weighted age concentrations as a function of stellar mass. The different concentrations are determined by measuring the slopes of the three innermost annuli of each curve individually. In each panel, BlueSFGs, RedSFGs, and QG are marked by blue, red and yellow dots, respectively. The medians in stellar mass bins are displayed for each population as diamonds, color-coded by the median dust attenuation in the bin. Uncertainties are represented by shaded regions of the color of the represented population and represent the 68th and 32th quantiles of the distributions in each stellar mass bin. The medians are centered on the median stellar mass of each bin containing at least four galaxies (with the exception of the most massive QG bin, which contains only one galaxy).
, sSFR, and mass-weighted age concentrations as a function of stellar mass. The different concentrations are determined by measuring the slopes of the three innermost annuli of each curve individually. In each panel, BlueSFGs, RedSFGs, and QG are marked by blue, red and yellow dots, respectively. The medians in stellar mass bins are displayed for each population as diamonds, color-coded by the median dust attenuation in the bin. Uncertainties are represented by shaded regions of the color of the represented population and represent the 68th and 32th quantiles of the distributions in each stellar mass bin. The medians are centered on the median stellar mass of each bin containing at least four galaxies (with the exception of the most massive QG bin, which contains only one galaxy).
Current usage metrics show cumulative count of Article Views (full-text article views including HTML views, PDF and ePub downloads, according to the available data) and Abstracts Views on Vision4Press platform.
Data correspond to usage on the plateform after 2015. The current usage metrics is available 48-96 hours after online publication and is updated daily on week days.
Initial download of the metrics may take a while.