Fig. 6.
Download original image
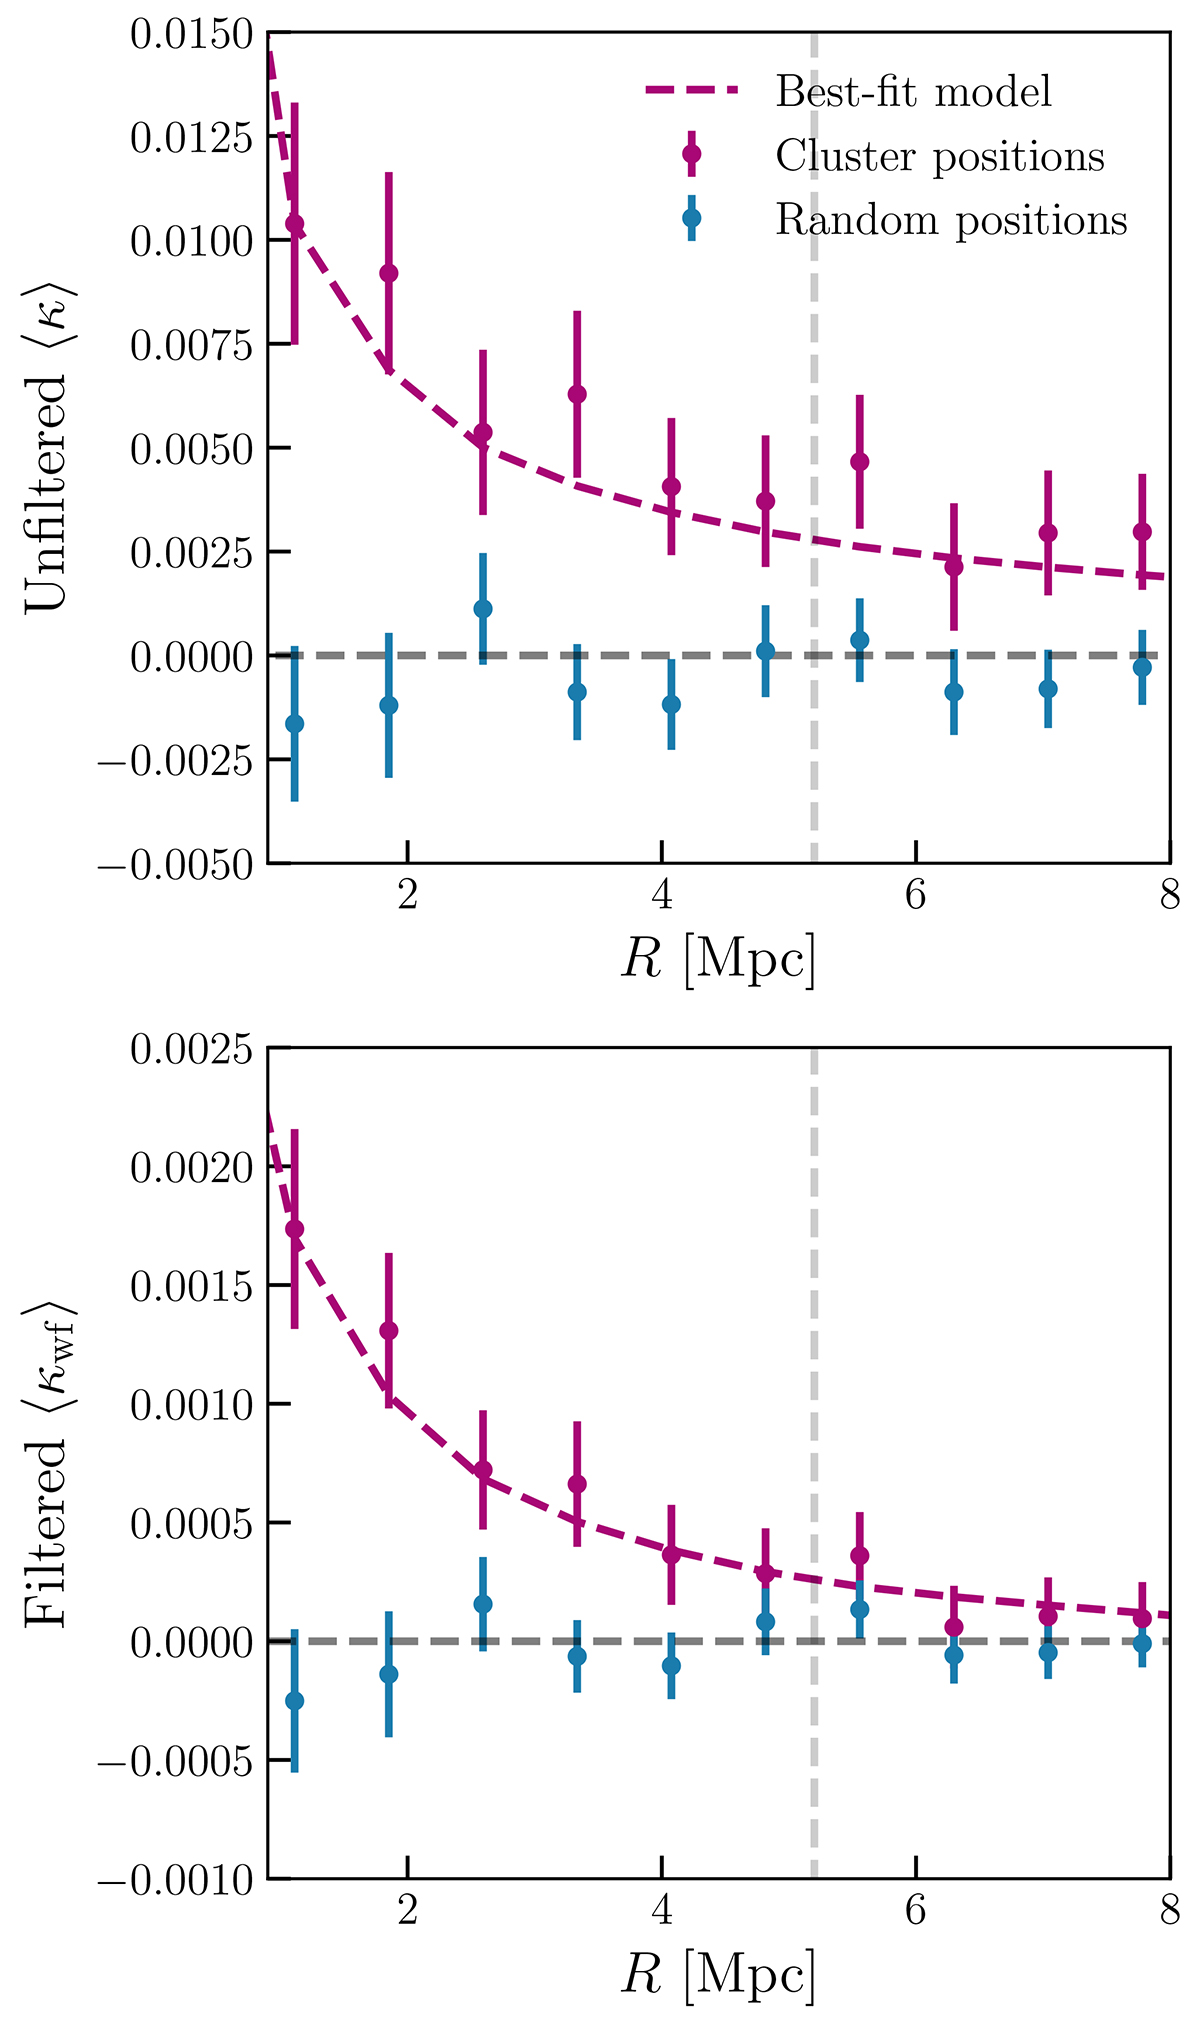
Top: Convergence profile for the unfiltered convergence field. Bottom: Convergence profile for the filtered convergence field. The error bars on each plot are the standard deviation of the bootstraps over the different cluster profiles. The best-fit model is calculated in Sect. 6. Only points to the left of the gray-vertical line are used for the cluster mass estimation. The mean redshift of the cluster sample is used to convert from the profiles measured in angles (a simpler measurement due to our pixel) to physical units.
Current usage metrics show cumulative count of Article Views (full-text article views including HTML views, PDF and ePub downloads, according to the available data) and Abstracts Views on Vision4Press platform.
Data correspond to usage on the plateform after 2015. The current usage metrics is available 48-96 hours after online publication and is updated daily on week days.
Initial download of the metrics may take a while.