Fig. 8
Download original image
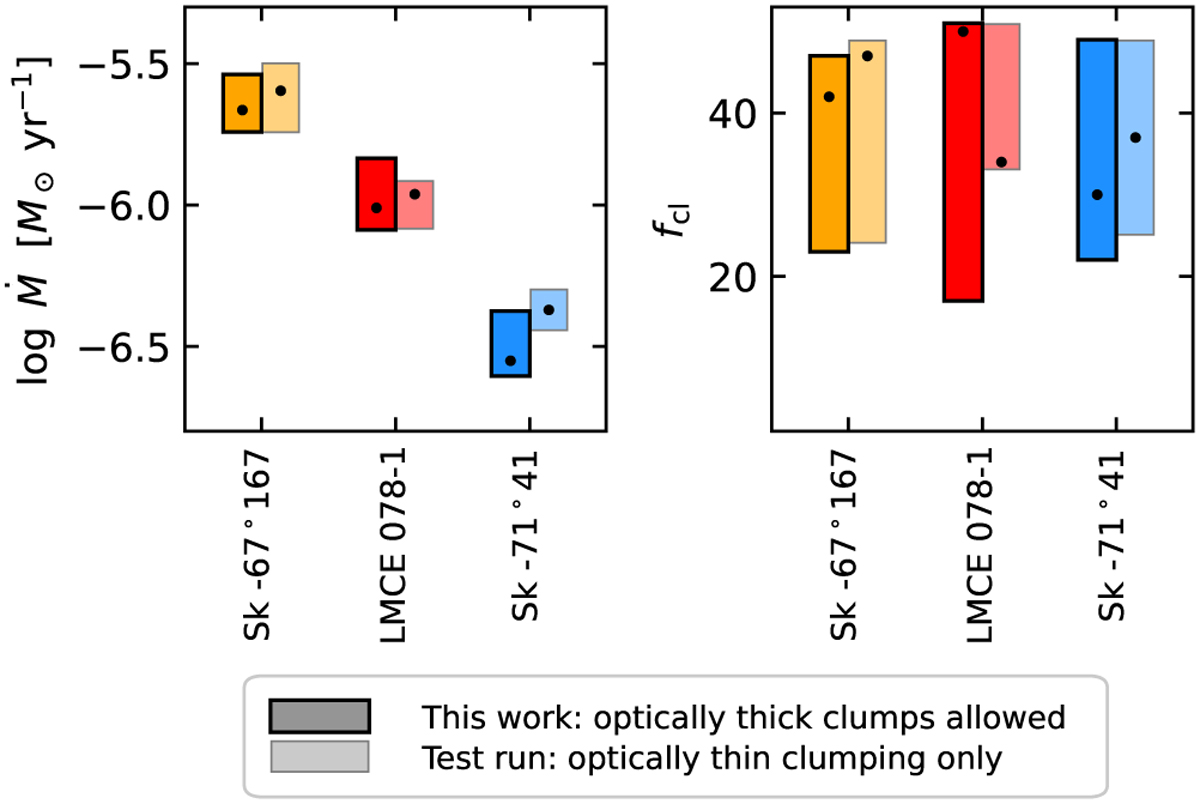
Comparison of mass-loss rates (left) and clumping factors (right) obtained with our default optical+UV fitting method using the clumping parameterisation of Sundqvist & Puls (2018) allowing for optically thick clumps (darker shades), versus those obtained using the optically-thin clumping approach. Yellow, red, and blue bars correspond to the 1σ uncertainties of Sk -67°167, LMCe 078-1, and Sk -71°41, respectively, and the best fit values are indicated with a black dot. The values derived with the two parameterisations are in good agreement for both massloss rates and clumping factors.
Current usage metrics show cumulative count of Article Views (full-text article views including HTML views, PDF and ePub downloads, according to the available data) and Abstracts Views on Vision4Press platform.
Data correspond to usage on the plateform after 2015. The current usage metrics is available 48-96 hours after online publication and is updated daily on week days.
Initial download of the metrics may take a while.