Fig. F.1
Download original image
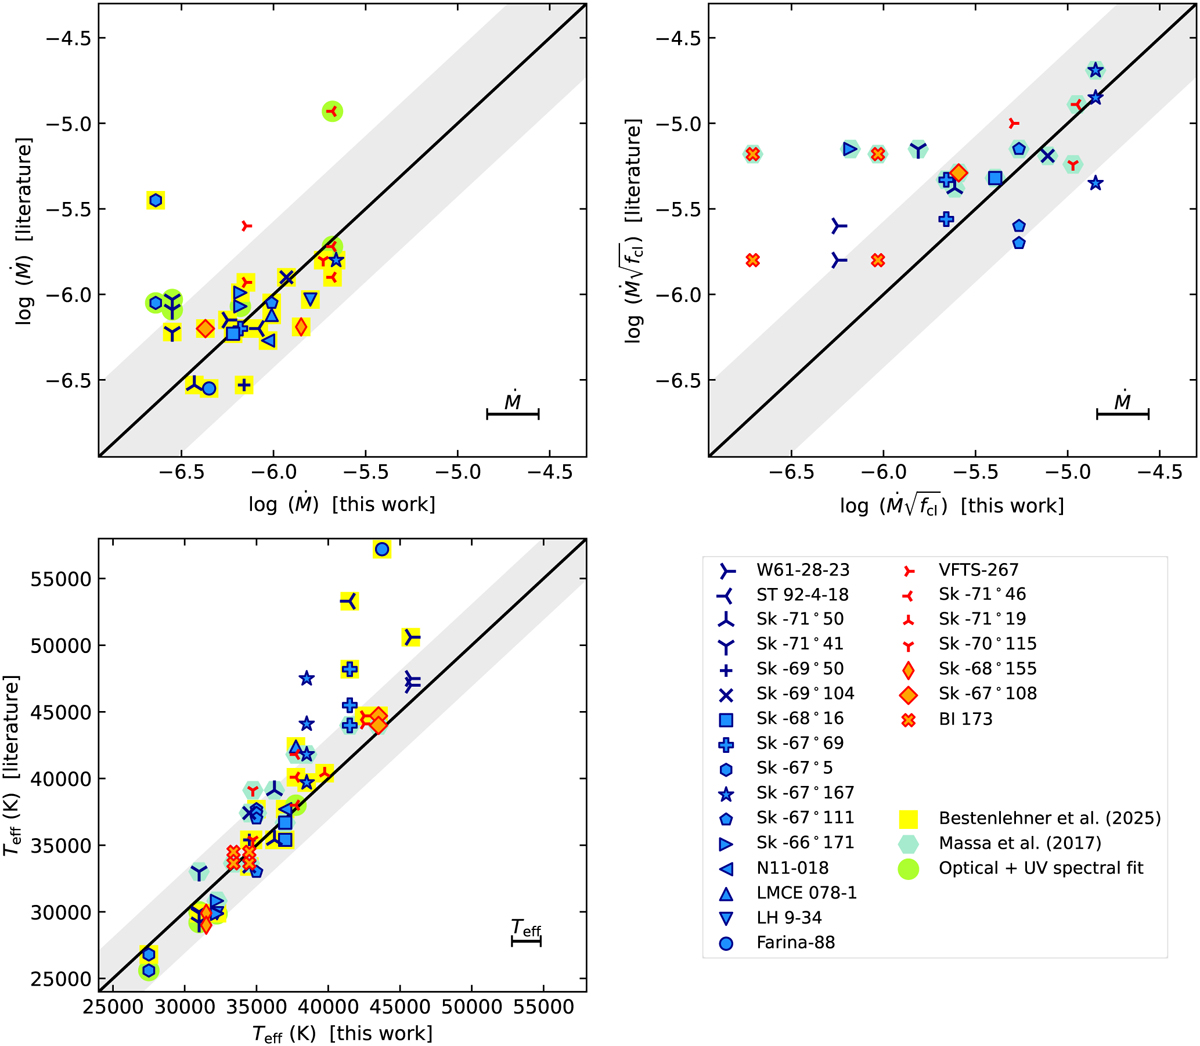
Values of ![]() (top left),
(top left), ![]() (top right) and Teff (lower left) derived in this work compared to values found in literature. Studies that include clumping (either by fitting a clumping factor or assuming it) are shown in the
(top right) and Teff (lower left) derived in this work compared to values found in literature. Studies that include clumping (either by fitting a clumping factor or assuming it) are shown in the ![]() -plot; studies that do not consider clumping are shown in the
-plot; studies that do not consider clumping are shown in the ![]() -plot. The Teff-plot contains all values. Blue symbols correspond to the presumed single stars, orange-red symbols to the stars with signs of binarity; various markers indicate different sources. In the corner of each panel the typical error bar of values derived in this work is shown. The majority of the literature values come from Massa et al. (2017) and Bestenlehner et al. (2025); these are marked in the plot (light blue hexagons and yellow squares, respectively). References to other studies included in this plot can be found in Tables F.1 and F.2. Values derived using quantitative optical and UV spectroscopy are marked with green circles. The black diagonal line indicates where the literature values equal ours, and the grey area corresponds to the systematic uncertainty that can be expected when analysing O-star spectra with different codes and methods (see Sander et al. 2024).
-plot. The Teff-plot contains all values. Blue symbols correspond to the presumed single stars, orange-red symbols to the stars with signs of binarity; various markers indicate different sources. In the corner of each panel the typical error bar of values derived in this work is shown. The majority of the literature values come from Massa et al. (2017) and Bestenlehner et al. (2025); these are marked in the plot (light blue hexagons and yellow squares, respectively). References to other studies included in this plot can be found in Tables F.1 and F.2. Values derived using quantitative optical and UV spectroscopy are marked with green circles. The black diagonal line indicates where the literature values equal ours, and the grey area corresponds to the systematic uncertainty that can be expected when analysing O-star spectra with different codes and methods (see Sander et al. 2024).
Current usage metrics show cumulative count of Article Views (full-text article views including HTML views, PDF and ePub downloads, according to the available data) and Abstracts Views on Vision4Press platform.
Data correspond to usage on the plateform after 2015. The current usage metrics is available 48-96 hours after online publication and is updated daily on week days.
Initial download of the metrics may take a while.