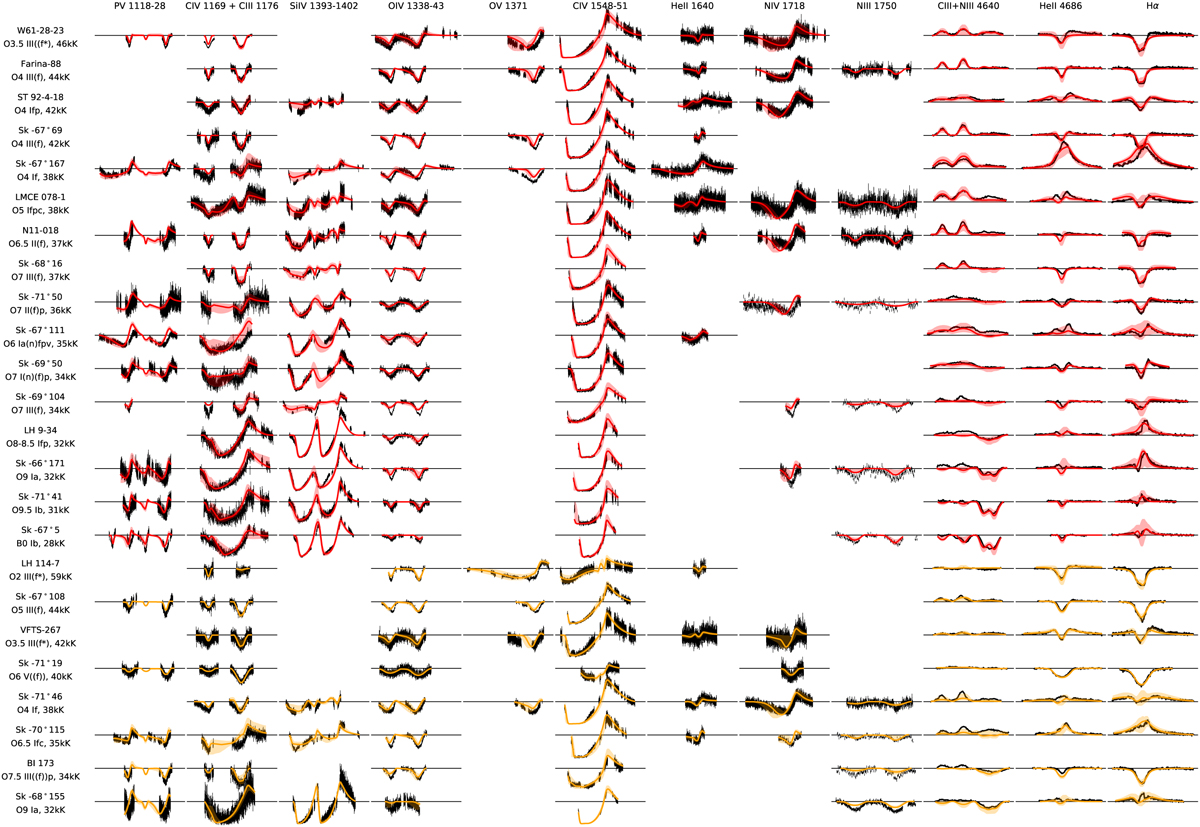
Fig. B.1
Download original image
Normalised spectra (black) and best fit models of the UV lines, as well as the N III-C III complex, He II λ4686, and Hα for all presumed single stars (red) and binaries (orange), ordered by increasing Teff. The shaded areas indicate 2σ uncertainties. Black horizontal lines indicate the continuum; the continua of the different stars are plotted 1.5 normalised flux units apart for the UV lines, and 0.45 for the optical lines. Fig. 1 and similar plots for the other sources that can be found on Zenodo provide a more comprehensive overview per star.
Current usage metrics show cumulative count of Article Views (full-text article views including HTML views, PDF and ePub downloads, according to the available data) and Abstracts Views on Vision4Press platform.
Data correspond to usage on the plateform after 2015. The current usage metrics is available 48-96 hours after online publication and is updated daily on week days.
Initial download of the metrics may take a while.