Fig. 11
Download original image
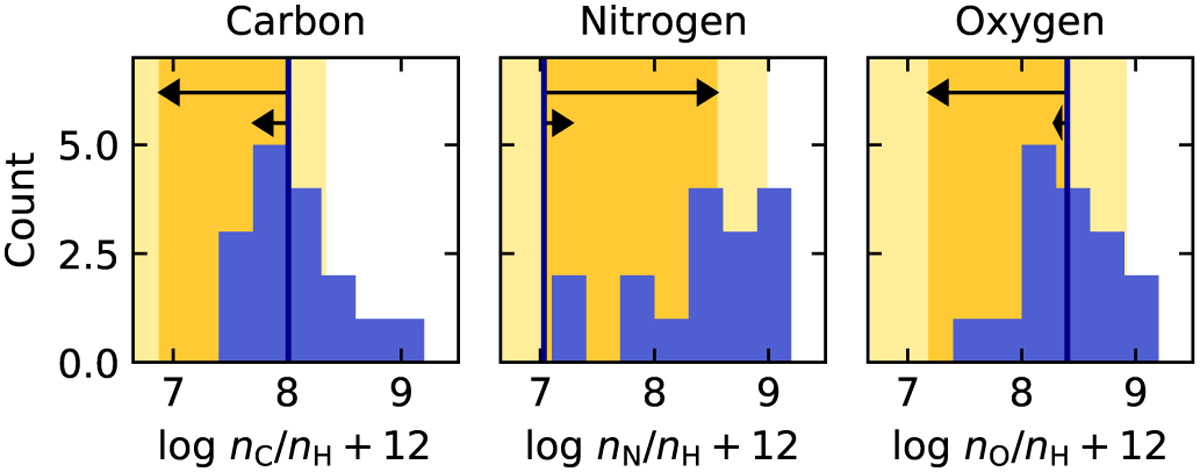
Distribution of observed CNO abundances for our (presumed) single stars. The vertical line indicates the baseline abundances (taken from Crowther et al. 2022); the black arrows denotes the expected change in abundance when the star evolves (nitrogen enrichment, oxygen and carbon depletion), where the size of the top arrow indicates a relatively large change in abundance (corresponding to a Mini = 80 M⊙, vini = 300 km s–1 model of the Köhler et al. (2015) grid at 2.5 Myr) and the bottom arrow indicates a relatively small change (corresponding to a Mini = 40 M⊙, vini = 200 km s–1 model of the Köhler et al. (2015) grid at 2.5 Myr). The orange shaded region indicates the values that are in agreement with the expected enrichment/depletion; this range of ‘allowed values’ is based on the change in the Mini = 80 M⊙, vini = 300 km s–1 model and is extended with the average uncertainty on the observationally inferred stellar abundances (light yellow shaded region). For both carbon and oxygen, part of the stars fall outside the region of expected values.
Current usage metrics show cumulative count of Article Views (full-text article views including HTML views, PDF and ePub downloads, according to the available data) and Abstracts Views on Vision4Press platform.
Data correspond to usage on the plateform after 2015. The current usage metrics is available 48-96 hours after online publication and is updated daily on week days.
Initial download of the metrics may take a while.